Isotope shifts and other isotope effects
Isotope shifts
Isotope shifts are the small changes in chemical shift observed between isotopomers of a molecule. They are useful for structural and bonding studies as well as spectral assignment. The most commonly studied substitution is that of proton (1H) with deuterium (2D) although a wide range of substitutions may be studied.
Factors affecting the magnitude of isotope shifts are the fractional change in mass of the atom (greatest for hydrogen), the chemical shift range and the distance or number of bonds between the exchanged and observed nuclei.
There are two classes of isotope shifts:
- Primary – the change in chemical shift of an atom when its isotope is changed, for example, the 1H chemical shift versus the 2D chemical shift.
- Secondary – the change in chemical shift of an atom when the isotope of one of the neighboring atoms is changed, for example, the 13C chemical shift difference between CH3OH and CH3OD.
Nomenclature
An isotope shift is defined as the chemical shift change caused by exchanging a heavier nucleus for a lighter nucleus of the same element. Expressed as an equation this is:
nΔX(H) = δX(L)-δX(H)
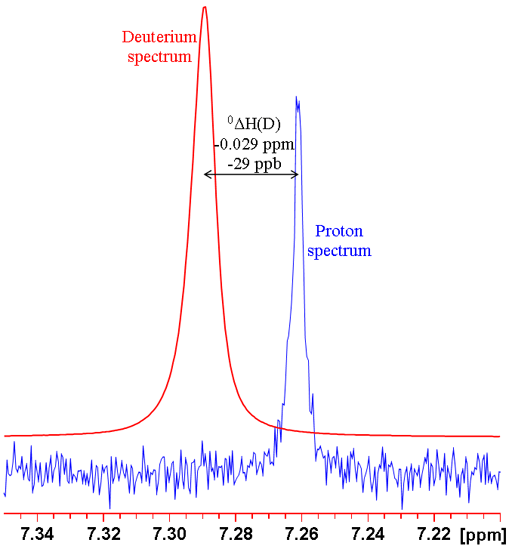
where n is the number of bonds between the exchanged isotope and the observed nucleus (zero for a primary isotope shift), X is the observed nucleus, L is the lighter of the exchanged isotope, H is the heavier of the exchanged isotope and δ is the chemical shift. For example the isotope shift of hydrogen observed in CHCl3 on exchanging the proton for a deuterium (CDCl3) is given by 0ΔH(D) = -0.029 ppm (fig. 1). Often isotope shifts are expressed in parts per billion (ppb) because they are so small. Hence -0.029 ppm may be written -29 ppb.
Fig. 1. Comparison of 1H and 2D spectra of CDCl3 (with CHCl3 impurity) showing a primary isotope shift
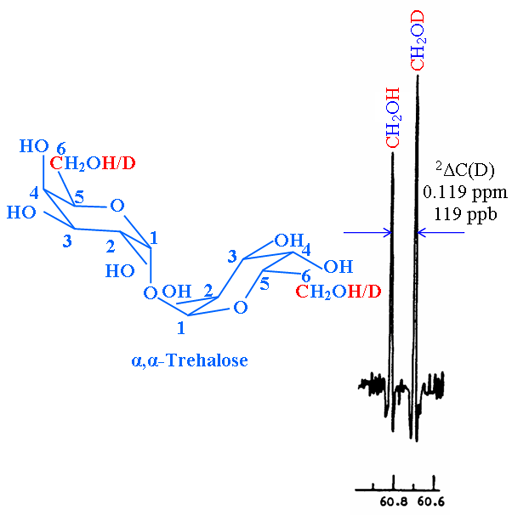
In another example, the isotope shift of the exchanging OH with OD on the 13C spectrum (fig. 2) is given by 2ΔC(D) = 0.119 ppm.
Fig. 2. 13C spectrum of C-6 of partially deuterated α,α-trehalose showing a secondary isotope shift
If there is more than one possible lighter nucleus then the following notation is used:
nΔX(L, H) = δX(L)-δX(H)
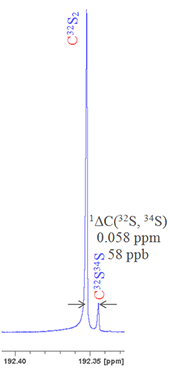
For example, sulfur has four stable isotopes: 32S (95.0% natural abundance), 33S (0.76%), 34S (4.22%) and 36S (0.02%). Say we want to measure the isotope shift caused by changing the isotope of sulfur on the 13C signal of CS2 then if we look at the second most abundant isotope, 34S, as related to a lighter isotope then we must specify which one. Given that 32S is by far the most abundant and that 33S is made more difficult to observe due to quadrupolar broadening, then 32S is clearly the nucleus of choice. Nonetheless this must be specified to avoid ambiguity. Hence the isotope shift is written as follows: 1ΔC(32S, 34S) = 0.058 ppm (fig. 3).
Fig. 3. 13C spectrum of CS2 showing the secondary isotope shift due to substitution with 34S
Primary isotope shifts
A primary isotope shift is the change in chemical shift observed between spectra of different isotopes of the same element, such as proton and deuterium. Primary isotope shifts between 1H and 2D and are usually less than 0.1 ppm. However, they are usually larger in strongly hydrogen bonded systems, their magnitude indicating the strength of the hydrogen bonding. Occasionally primary deuterium isotope shifts over 1 ppm are observed. Primary isotope shifts have been studied for other atoms that have more than one NMR active nucleus such as 10/11B, 35/37Cl, 50/51V, 117/119Sn and 123/125Te.
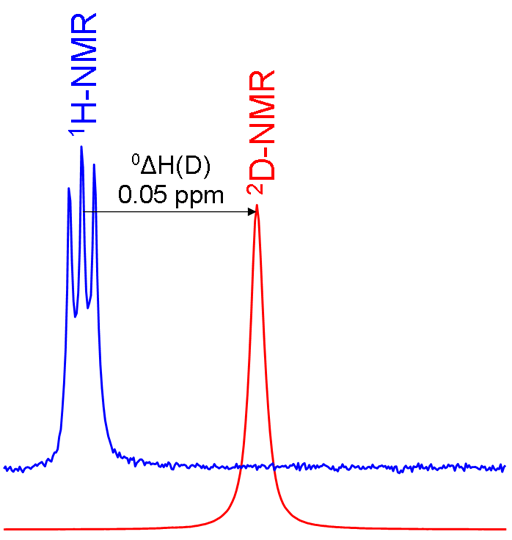
Primary isotope shifts are measured by acquiring spectra of the two isotopes and referencing them according to the standard frequency ratio (Ξ). If the hydrogen is isolated as in the chloroform example above then the isotope shift can be measured directly between the two singlets in the spectra. However, if there is more than one equivalent hydrogen such as in methylene chloride (CD2Cl2) and only one hydrogen is exchanged then the spectrum of CHDCl2 shows proton-deuterium coupling. In this case the proton signal is split into three by the spin-1 deuterium nucleus (fig. 4).
Fig. 4. Comparison of 1H and 2D spectra of CD2Cl2 (with CHDCl2 impurity) showing a primary isotope shift and 2D coupling in the 1H spectrum
Secondary isotope shifts
Secondary isotope shifts have been widely studied. Isotope shifts on protons are generally small. Large 1H/2D isotope shifts on neighboring protons usually indicate hydrogen bonding but may also arise from steric hindrance.
Larger isotope shifts are observed on other atoms, for example 13C. One-bond isotope shifts arising from deuterium substitution vary between 0.2 and 1.5 ppm. Two-bond shifts are typically 0.1 ppm. Three-bond effects depend on torsion angle among other things and may be between -0.02 and 0.07 ppm. Longer range effects are usually smaller than 0.01 ppm but may be larger if the bonding pathway is shortened by hydrogen bonding or other weak bonding effects or if there is steric hinderance at the substitution site that causes long range distortion of the molecule. By contrast, the one-bond effect of 12/13 on 1H is typically 0.002 ppm.
Secondary isotope shifts may be measured by observing a mixture of isotopomers. In most cases this means partial deuteration in systems with slow or no ambient exchange, such as deuteration of OH and NH. The resulting spectrum contains 'multiplets' where each signal corresponds to a different isotopomer (fig. 5). These 'multiplets' should not be confused with spin-spin coupled multiplets.
Fig. 5. 13C spectrum of C-3 of partially deuterated α,α-trehalose showing secondary isotope shifts arising from a variety of isotopomers
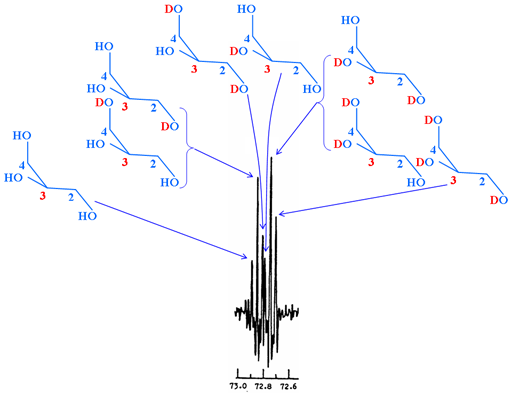
When there is fast exchange, then the overall isotope shift can be determined by comparison of the protiated exchanging solvent (usually H2O) with the deuterated solvent (usually D2O).
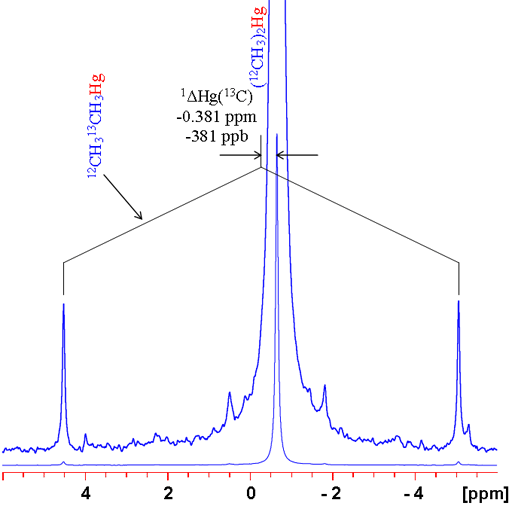
In many cases, changing the isotope causes a change in coupling pattern. For example 12C has no spin and therefore no scalar coupling while 13C has a large coupling constant with 1H. For isolated signals, a simple comparison can be made between the average of the doublet and the singlet (fig. 6). Two examples are shown: the 1H spectrum of tetramethylsilane (TMS) and 199Hg spectrum of dimethyl mercury (fig. 7). In both cases, the observed signal is isolated from homonuclear couplings allowing the isotope shift to be measured easily. Note that the isotope shift for mercury is about 300 times larger than that for proton. Similarly, mercury's chemical shift range is about 300 times larger than that of proton.
Fig. 6. 1H spectrum of TMS showing how to measure a 13C isotope shift on 1H for an isolated proton
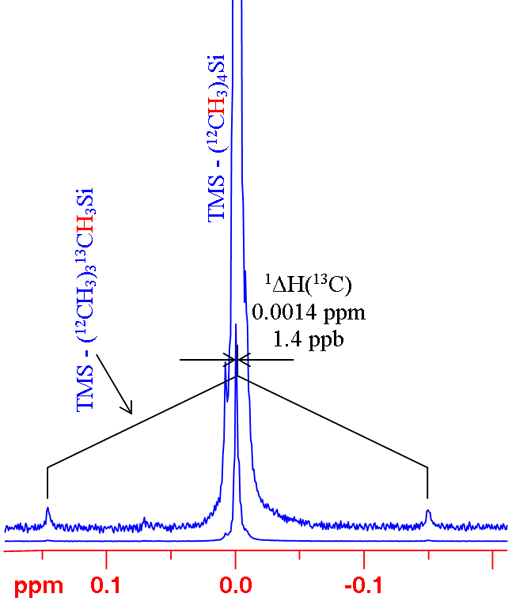
Fig. 7. 199Hg spectrum of dimethylmercury showing how to measure a 13C isotope shift. Note that the shift is large and the satellites are noticeably asymmetric.
Both isotopes may yield couplings and the couplings may be different. For example, when replacing a proton attached to a 13C with a deuterium, the splitting changes from a doublet (because 1H is spin-½) to a triplet (because 2D is spin-1) (fig. 8).
Fig. 8. 13C spectrum of CDCl3 (with CHCl3 impurity) showing a doublet for CHCl3 and a triplet for CDCl3
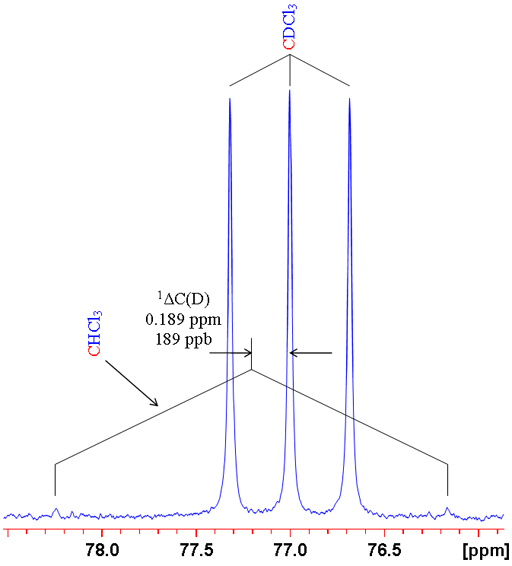
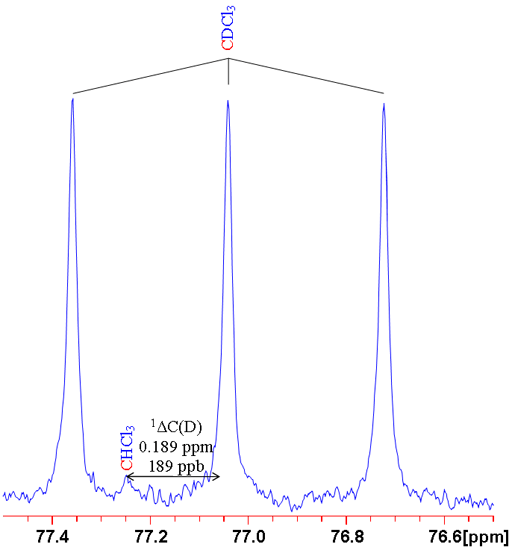
Usually 13C spectra are proton decoupled so the CHCl3 appears as a singlet (fig. 9).
Fig. 9. 13C spectrum of CDCl3 (with CHCl3 impurity) with proton decoupling showing a singlet for CHCl3 and a triplet for CDCl3
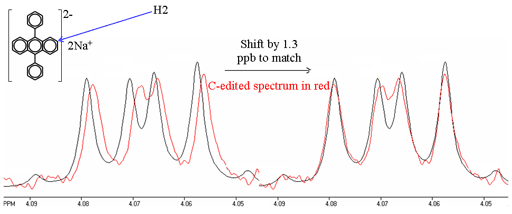
Whenever there is homonuclear coupling, second order coupling effects are usually larger than the isotope shift being measured. While, in principle, the second order effects can be accounted for, the calculation is complex and it is difficult to achieve the required accuracy. Therefore, it is better to use spectral editing techniques and compare spectra (fig. 10). However, extreme care must be taken to ensure identical conditions including thermal stability and equal sample heating by radiofrequency radiation because 1H chemical shifts typically change by 0.001 ppm/K.
Fig. 10. Comparison of 1H spectra of H2 of disodium diphenyl anthracene and its edited 13C substituted isotopomer at C2. The isotope shift is measured by fitting the two spectra. Note that the 13C labeled signal is slightly broader due to the extra relaxation pathway via 13C.
Isotope effects on spin-spin coupling
Primary isotope effects are combination of differences in the nuclear spin properties of the exchanging nucleus and differences in its resonant frequency. For example, a nucleus coupled with a spin-½ proton will produce a doublet while the same nucleus coupled to a spin-1 deuterium will produce a triplet.
The magnitude of the coupling is almost exactly proportional to the resonant frequency of the nucleus. For example an aromatic carbon having a 160 Hz coupling to 1H would be expected to have a 160 × 0.154 = 24.6 Hz coupling to 2D.
Secondary effects on couplings are usually slight. For example the effect on the two-bond coupling between 1H and 29Si in TMS is 6.64 Hz when there is a 12C between them but is reduced by 1.5% to 6.54 Hz when the intervening atom is 13C indicating a very slight increase in bond lengths.
Literature references
- P. E. Hansen "Isotope effects on nuclear shielding", Ann. Rep. NMR Spectrosc., 15, 105-234 (1983).
- P. E. Hansen "Isotope effects in nuclear shielding", Prog. NMR Spectrosc., 20, 207-255 (1988).
- D. B. Davies, J. C. Christofides, and R. E. Hoffman "Isotope Shifts in NMR Spectroscopy - Measurements and Applications", Isotopes: Essential Chemistry and Applications Ed. J. R. Jones, Royal Society of Chemistry (1988).