- HU NMR lab
- Login & order NMR service now
- NMR service
- NMR Relaxation
- What you should alr…
- Types of magnetic r…
- Ranges of relaxatio…
- Analysis and presen…
- Longitudinal or spi…
- Transverse or spin-…
- Spin-lattice relaxa…
- Dephasing time, T2*
- Improving experimen…
- Differences within …
- Applications of rel…
- What is NMR
- Techniques
- Apps
- Guides
- Contact us
- Terms & conditions
- עברית
NMR Relaxation
Use our NMR service to measure NMR relaxation times.
NMR relaxation is the processes by which an excited magnetic state returns to its equilibrium distribution. NMR relaxation measurement can be used for spectral assignment and the study of quadrupolar and paramagnetic interactions, and exchange dynamics.
What you should already know before continuing to read this:
Before you continue reading about NMR relaxation, you should have some knowledge of:
To understand the section on 3D-DOSY, you should have some knowledge of:
If you want to read about these subjects first, please go to the links above.
Use our NMR service to measure NMR relaxation times.
Types of magnetic relaxation
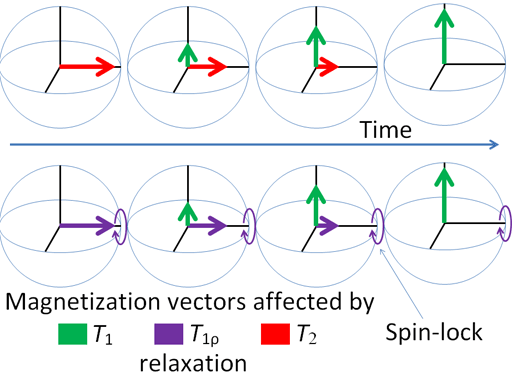
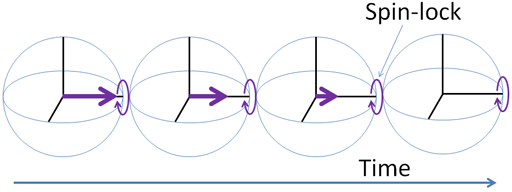
Any excited magnetic moment (generally excited by a radio-frequency pulse) relaxes back to equilibrium on the z-axis. There are two mechanisms involved: spin-lattice and spin-spin. Spin-spin relaxation is also referred to as transverse relaxation or T2 and describes the decay of the excited magnetization perpendicular to the applied magnetic field (fig.1). The observed spectral line-width is related to the spin-spin relaxation but is also affected by magnetic inhomogeneity. This combination of relaxation and inhomogeneity is referred to as the dephasing time or T2*. Spin-lattice relaxation is also referred to as longitudinal relaxation or T1 and describes the return to equilibrium in the direction of the magnetic field. The spin-lattice relaxation (T1) can be measured from the buildup of magnetization along the static applied magnetic field (conventionally the z-axis, fig. 1). Alternatively, the spin-lattice relaxation can be measured by the decay of a signal under spin-lock conditions that generate a rotating magnetic field near the resonant frequency perpendicular to the static magnetic field (conventionally the x-y-plane, fig. 1), in which case it becomes spin-lattice relaxation in the rotating frame or T1ρ.
In anisotropic systems, the spin-lattice relaxation also becomes anisotropic. The isotropic component is then termed the Zeeman relaxation whose time constant is T1,2Z. There is also a dipolar relaxation, T1,2D, and, for quadrupolar nuclei, a quadrupolar relaxation T1,2Q. As this website is mainly concerned with isotropic solution NMR, the anisotropy of T1 and T2 will not be discussed further.
Fig. 1. Relaxation of magnetization vectors after a 90° pulse. T1 relaxation along the z-axis in green, T2 relaxation in the x-y-plane in red and T1ρ with spin-lock in the x-y-plane in purple.
Ranges of relaxation times
Most relaxation times observed in routine NMR are between 0.1 and 10 seconds. Longer relaxation times, tens or hundreds of seconds, are observed in the absence of oxygen for deuterated solvents, quaternary carbon signals, medium-mass spin ½-nuclei and in the gas phase. Shorter relaxation times, milli- or microseconds, are observed when there is medium-to-fast chemical exchange, heavy spin-½ nuclei, paramagnetism and for quadrupolar nuclei.
Analysis and presentation
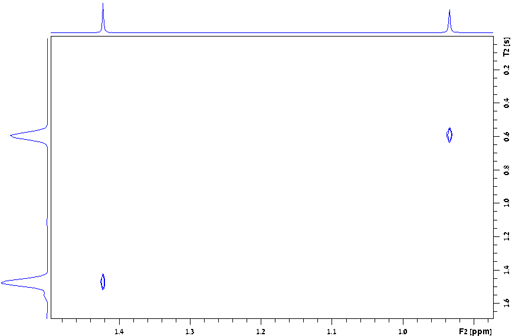
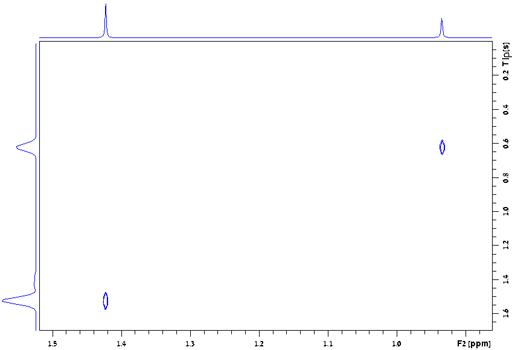
At the very least, relaxation measurements may be carried out by comparing two spectra acquired using different evolution times (τ) or, in the case of T1, a single spectrum that finds a null point. It is more accurate to measure many (typically 32) spectra with different evolution times (fig. 2) and fit the intensities to the relevant mathematical function (fig. 3). These functions are generally non-linear exponentials but can be linearized by using a logarithm function on the intensity. However, a linear fit in this manner is less accurate than the direct non-linear fit because too much weight is attributed to the noisier points of low intensity (fig. 4). These fitting methods only address one point at a time. It is much more efficient to process the whole spectrum at once and represent it as a contour plot of relaxation time against chemical shift. This is performed by carrying out a non-linear fit on all the columns in the spectrum in an operation called an inverse of the Laplace transform. The relaxation time is presented here as increasing from top to bottom (fig. 5) as is customary for DOSY spectra even though this is the opposite sense to what is used for most other applications.
Fig. 2. Stack plot representation of a relaxation measurement: T2 measurement of the tbutyl protons of 12,14-ditbutylbenzo[g]chrysene under vacuum at 500 MHz at 25°C
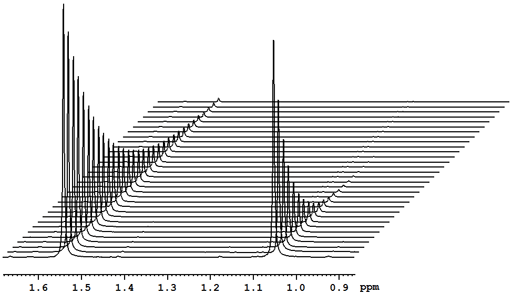
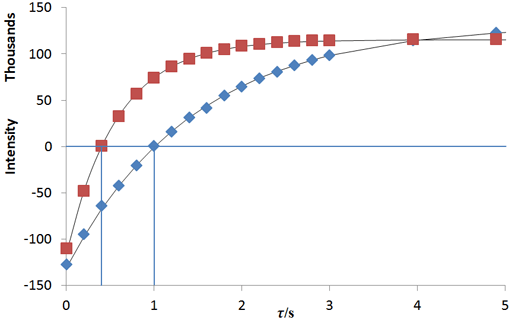
Fig. 3. A non-linear fit to a relaxation decay gives the most accurate values for relaxation times: Exponential T2 decay curves for the tbutyl protons of 12,14-ditbutylbenzo[g]chrysene under vacuum at 500 MHz at 25°C
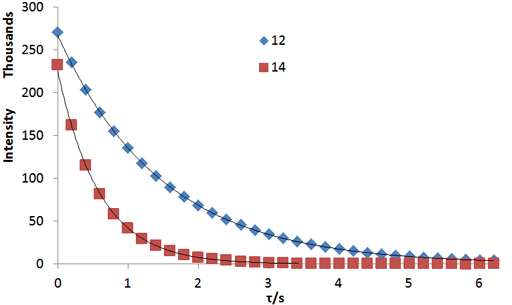
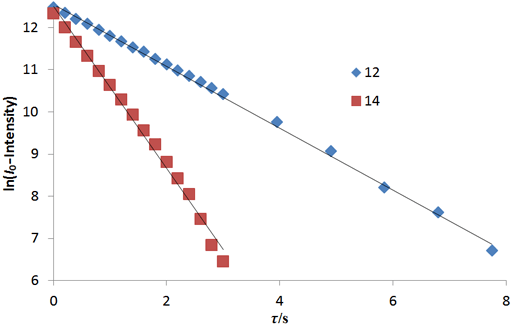
Fig. 4. A linear fit to a linearized function is a simple method of analysis although it is less accurate than the non-linear method: Linear fits to the logarithms of exponential T2 decay curves for the tbutyl protons of 12,14-ditbutylbenzo[g]chrysene under vacuum at 500 MHz at 25°C
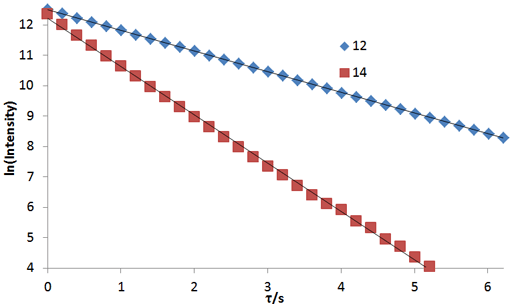
Fig. 5. Inversion of the Laplace transform gives a plot of relaxation time against chemical shift: Contour plot for the T2 spectrum of the tbutyl protons of 12,14-ditbutylbenzo[g]chrysene under vacuum at 500 MHz at 25°C
Longitudinal or spin-lattice relaxation, T1
Longitudinal or spin-lattice relaxation (T1) is the mechanism by which an excited magnetization vector returns to equilibrium along the axis of the static applied magnetic field (conventionally shown along the z-axis, fig. 6).
Fig. 6. Relaxation via T1 along the magnetic-field (z) axis

The inversion recovery (T1) pulse sequence (fig. 7) inverts the
magnetization on the z-axis so that the second pulse yields a
signal of intensity directly proportional to the relaxing
magnetization along that axis: negative for short evolution times
and positive for long evolution times (fig. 8). The intensity of the
signal is described by the equation: ![I0[1-2exp(τ/T1)]](t1t2_files/eqir.gif) . The
intensity is zero at T1ln(2) (0.693T1)
so the value of T1 can be measured by running
single experiments, changing the value of τ until a null
intensity is found. If the intensity is positive then τ needs
to be reduced and if it is negative then τ needs to be
increased. The value of T1 is 1.443τnull.
In the example below (fig. 9), τnull's are 0.40
and 1.01 s so T1's are 0.58 and 1.45 s.
. The
intensity is zero at T1ln(2) (0.693T1)
so the value of T1 can be measured by running
single experiments, changing the value of τ until a null
intensity is found. If the intensity is positive then τ needs
to be reduced and if it is negative then τ needs to be
increased. The value of T1 is 1.443τnull.
In the example below (fig. 9), τnull's are 0.40
and 1.01 s so T1's are 0.58 and 1.45 s.
Fig. 7. Inversion recovery pulse sequence for measuring T1

Fig. 8. Inversion recovery stack plot for the T1 spectrum of the tbutyl protons of 12,14-ditbutylbenzo[g]chrysene under vacuum at 500 MHz at 25°C. The peak on the left relaxes slower than the peak on the right.
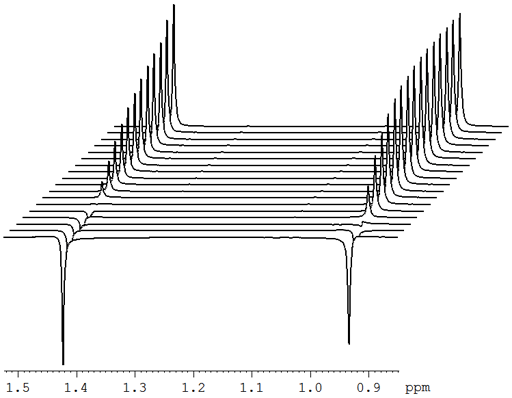
Fig. 9. Non-linear fit showing the null points for the T1 spectrum of the tbutyl protons of 12,14-ditbutylbenzo[g]chrysene under vacuum at 500 MHz at 25°C.
The fitting function can be made by plotting the log of the intensity after a long evolution time minus the intensity against time. However, a linear fit in this manner is less accurate than the direct non-linear fit because too much weight is attributed to the noisier points of low intensity (fig. 10). The slopes (1.92 and 0.73 s-1) are the reciprocals of the relaxation times (0.52 and 1.37 s, respectively).
Fig. 10. Linear fit for the T1 spectrum of the tbutyl protons of 12,14-ditbutylbenzo[g]chrysene under vacuum at 500 MHz at 25°C.
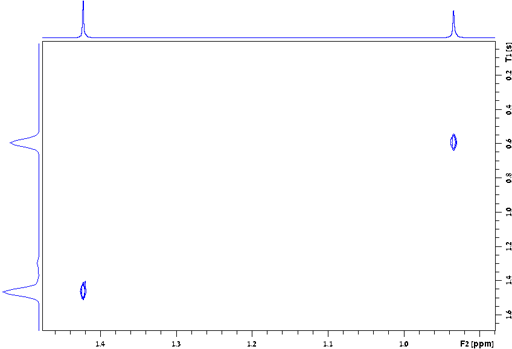
An inversion of the Laplace transform processed the whole spectrum to give a result (T1's of 0.59 and 1.47 s) in the form of a contour plot (fig. 11) that is easier to read and visualize than the stack plot (fig. 8) and is unaffected by possible bias in the choice of the position in the spectrum for processing.
Fig. 11. Contour fit of the T1 spectrum of the tbutyl protons of 12,14-ditbutylbenzo[g]chrysene under vacuum at 500 MHz at 25°C.
For extremely long T1
relaxation times such as in the gas phase it may not be possible to
prevent diffusion and convection into and out of the coil area. In
such cases, the sample should be removed from the magnet for at
least five T1 which may be several hours. The
sample can then be reinserted and a regular 1D acquisition with a
very small pulse angle applied every minute or so for a period of a
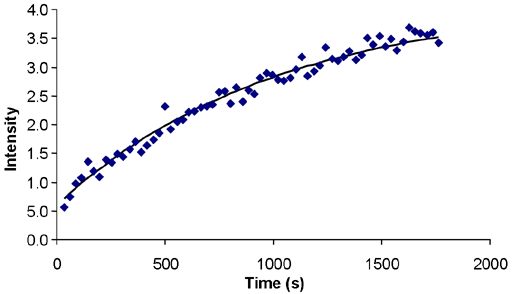
few T1's. The build-up of intensity follows the
equation ![I0[1-exp(τ/T1)]](t1t2_files/buildup.gif) where τ is the time since
insertion. In the case of 3He
gas at a pressure of two atmospheres, the T1
appears to be about 1 s when measured by inversion recovery due to
diffusion out of the receiver coil area while the true value is a
little more than 1000 s (fig. 12).
where τ is the time since
insertion. In the case of 3He
gas at a pressure of two atmospheres, the T1
appears to be about 1 s when measured by inversion recovery due to
diffusion out of the receiver coil area while the true value is a
little more than 1000 s (fig. 12).
Fig. 12. Signal buildup of 3He gas (2 atm) as a function of time after insertion into the magnet on a 400 MHz instrument (304 MHz 3He) at 25°C. The T1 is just over 1000 s.
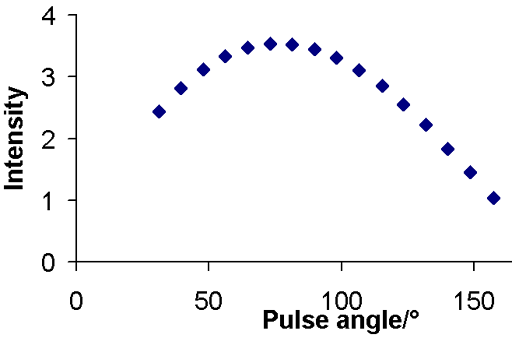
The long relaxation delay required by the inversion recovery experiment is a problem when sensitivity is low and when the relaxation time is long or when there is moderate convection as in the example of ethylbenzene. In such cases, the DESPOT method (driven equilibrium single pulse observation of T1 also known as the variable nutation angle method) can be used. The intensity is plotted as a relation of pulse angle (fig. 13).
Fig. 13. DESPOT curve for the methyl protons of ethylbenzene (0.1%) in CDCl3 at 400 MHz at 25°C
Two or more regular 1D experiments are carried out with different
pulse angles. There is no need for a long relaxation delay but the
experiment must start with dummy scans that continue for at least 5T1.
The pulse angle must be calibrated accurately taking into account
the rise time of the transmitter, typically 0.1 μs (larger in old
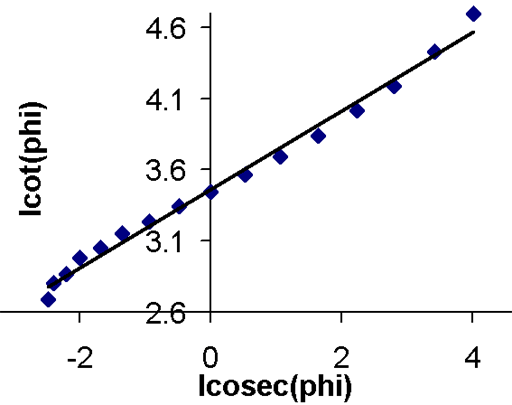
spectrometers). A plot (fig. 14) of I cosec(φ) against
I cot(φ) gives a straight line of slope  where φ is the pulse
angle and Tr is the time between acquisitions. In
the case of the methyl of ethylbenzene,
the T1 is 17.4 s.
Fig. 14. Linear DESPOT plot for the methyl protons of ethylbenzene (0.1%) in CDCl3 at 400 MHz
If only two angles are used then the relaxation time can be
expressed analytically as ![T1=Tr/ln[(I1sinφ2cosφ1-I2sinφ1cosφ2)/(I1sinφ2-I2sinφ1)]](t1t2_files/despot2point.gif) . If the two angles, φ1
and φ2, are 45° and 90° respectively then this
simplifies to
. If the two angles, φ1
and φ2, are 45° and 90° respectively then this
simplifies to ![T1=Tr/ln{-I2sqrt[2]/[I1-I2sqrt(2)]}](t1t2_files/despot2pointsimple.gif) .
.
In the case of the methyl protons of ethylbenzene, I1 = 3.4469, I2 = 3.1118 this gives at T1 of 15.0 s which is reasonably close for a two point experiment and certainly good enough if the purpose is to select a reasonable relaxation delay in another experiment.
Transverse or spin-spin relaxation, T2
Transverse or spin-spin relaxation (T2) is the mechanism by which the excited magnetization vector (conventionally shown in the x-y-plane) decays (fig. 15).
Fig. 15. T2 relaxation mechanism

The magnitude of the magnetic moment in the x-y plane
decays according to  . The CPMG T2
experiment (fig. 16) yields signals of intensity
  where τ is the total
evolution time (2Δ). This pulse
sequence is best for singlets but is very sensitive to instrumental
phase and environmental instability for long relaxation times.
Fig. 16. Spin-echo pulse sequence for measuring T2

The spin-echo sequence does not refocus spin-spin coupling.
Therefore, multiplets require a multipulse sequence called
CPMG-PROJECT (Carr-Purcell-Meiboom-Gill with Periodic Refocusing of
J Evolution by Coherence Transfer, fig. 17) to suppress the
coupling artifacts, thereby allowing an accurate measurement of T2
to be made. The mixing time, τ, is 2nΔ. The value of Δ
in the pulse sequence should be much shorter than the reciprocal
coupling constant,  , but long enough that the sample
should not heat up significantly while keeping the pulse time to
less than 1% of the duty-cycle (proportion of the mixing time that
the pulse is on) in order to minimize spectral instability and the
contribution from T1ρ, and to prevent
overheating. A value for Δ of 5 ms is usually appropriate for 1H spectra with
homonuclear coupling. The experiment is repeated many times with
different values of τ and the resulting intensities are used
to find the value of T2. Like the basic T2
spin-echo pulse sequence this one is still very sensitive to
environmental changes during acquisition, especially for long
relaxation times.
Fig. 17. CPMG-PROJECT pulse sequence for measuring T2

Fig. 2 above shows a stack plot of the measurement of the T2 for the tbutyl protons of 12,14-ditbutylbenzo[g]chrysene. The peak on the left decays more slowly and therefore has a longer T2 than the right-hand peak. A plot of peak height against mixing time (τ) gives exponential decays (fig. 3 above) with rate constants of 1.68 and 0.68 s-1 that correspond to T2 values of 0.60 and 1.47 s. The curves can be linearized by using the logarithm of the intensity (fig. 4 above) yielding linear fits that correspond to T2 values of 0.63 and 1.47 s. The discrepancy in the value for tbutyl14 is due to the attribution of too much weight to noise-affected points of low intensity in the linearized fit. An inversion of the Laplace transform for the mixing time gives a contour plot with T2 values of 0.59 and 1.47 s (fig. 5 above).
Spin-lattice relaxation in the rotating frame, T1ρ
Spin-lattice relaxation in the rotating frame (T1ρ) is the mechanism by which the excited magnetization vector (conventionally shown in the x-y-plane) decays (fig. 18) while under the influence of spin-lock radio-frequency irradiation that is effectively a weak magnetic field in the x-y-plane that rotates at a similar frequency to the magnetization vector. The result is much the same as one would get by measuring the T1 at very low magnetic fields with a proton resonance of tens of kHz.
Fig. 18. T1ρ relaxation mechanism
T1ρ is measured using a spin-lock pulse sequence (fig. 19) to yield a
signal intensity of  where τ
is the spin-lock pulse length. The experiment is repeated many times
with different values of τ and the resulting intensities used
to find the value of T1ρ. If the sample is
very concentrated then the relaxation time will appear shorter than
it really is due to saturation. In such a case, off-tune the probe,
recalibrate the pulse widths and repeat the experiment.
Fig. 19. Pulse sequence for measuring T1ρ

The T1ρ experiment is generally noisier than the T2 experiment because it causes more sample heating, especially for large values of T1ρ.
Fig. 20 shows a stack plot of the measurement of the T1ρ for the tbutyl protons of 12,14-ditbutylbenzo[g]chrysene . The peak on the left decays more slowly and therefore has a longer T1ρ than the right-hand peak. A plot of peak height against mixing time (τ) gives exponential decays (fig. 21) with rate constants of 1.57 and 0.65 s-1 that correspond to T1ρ values of 0.64 and 1.55 s. The curves can be linearized by using the logarithm of the intensity (fig. 22) yielding linear fits that correspond to same T1ρ values of 0.64 and 1.55 s. An inversion of the Laplace transform for the mixing time gives a contour plot with T2 values of 0.63 and 1.54 s (fig. 23).
Fig. 20. T1ρ stack plot of the tbutyl protons of 12,14-ditbutylbenzo[g]chrysene
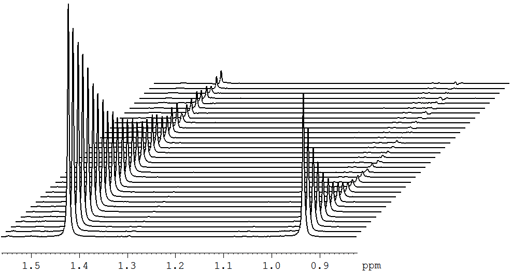
Fig. 21. Exponential T1ρ decay curves for the tbutyl protons of 12,14-ditbutylbenzo[g]chrysene
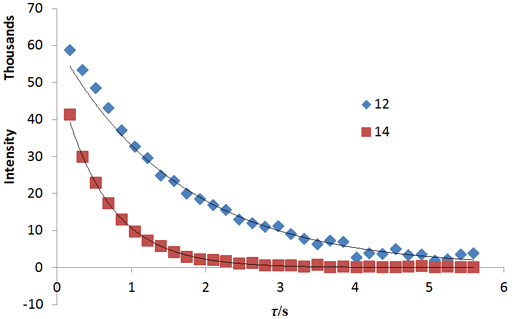
Fig. 22. Linear fits to the logarithms of exponential T1ρ decay curves for the tbutyl protons of 12,14-ditbutylbenzo[g]chrysene
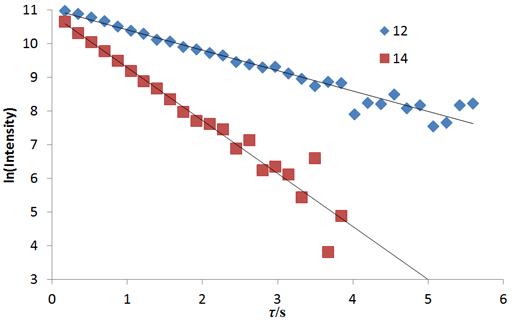
Fig. 23. Contour plot for the T1ρ spectrum of the tbutyl protons of 12,14-ditbutylbenzo[g]chrysene
Dephasing time, T2*
The dephasing time, T2*, also known as the
effective transverse relaxation time, is a combination of transverse
relaxation and magnetic field inhomogeneity. In a perfectly
homogeneous magnetic field T2* = T2
but T2* is shorter when the field is
inhomogeneous, i. e., when the shimming is not perfect. The
dephasing time is the reciprocal of π times the line-width at
half height (w½):  . For a well shimmed and
stabilized spectrometer with a homogeneous sample in a good quality
NMR tube the contribution to the linewidth of inhomogeneity and
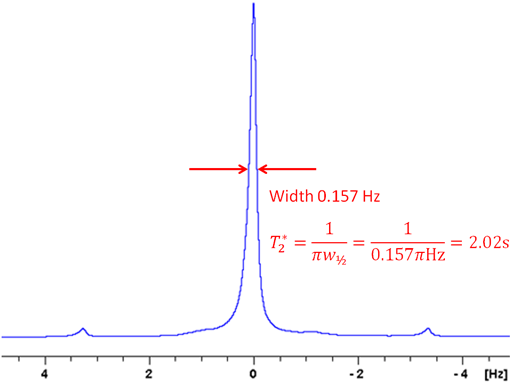
field instability is about 0.1 Hz. For example, the line-width of
the signal of TMS in fig. 24 is 0.157 Hz, giving a T2*
of 2.02 s. The T2 of TMS is 13.1 s and contributes
0.024 Hz to the line-width, the remaining 0.133 Hz being from
inhomogeneity and field instability. (The satellite signals in the
spectrum are real signals arising from heteronuclear coupling.)
Fig. 24. Measurement of the T2* of TMS in CDCl3
Improving experimental accuracy
To maximize accuracy and reliability of relaxation measurements, one must be aware of the effects of noise, saturation, thermal convection and, in gasses, diffusion.
Noise should be kept to a minimum. For insensitive samples, more than one scan per row may be needed. Care must be taken to ensure that the experimental conditions (temperature, etc.) are stable and that the pulses have been calibrated carefully. The τ values should be chosen to cover the range zero to twice the expected relaxation time if the relaxation times are similar. If the relaxation times are not similar then the τ values should not be distributed evenly but at least four should be concentrated within the minimum relaxation time. For T1 measured by inversion recovery, one measurement should be carried out with a τ of five to seven times the maximum T1 should be made and a few measurements between that value and twice T1 may improve accuracy by confirming that the decay curve is truly monoexponential.
If the sample is very concentrated then the relaxation time will appear shorter than it really is due to saturation. In such a case, off-tune the probe, recalibrate the pulse-widths and repeat the experiment.
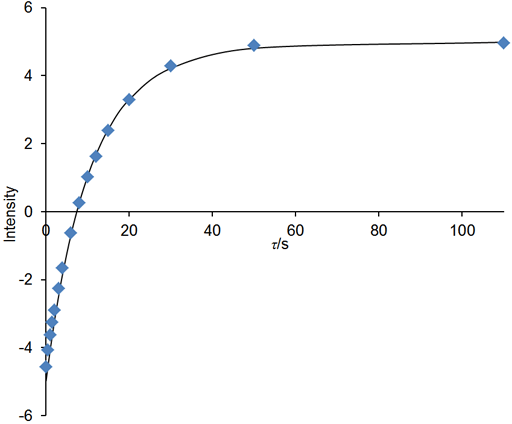
If the relaxation time is very long (greater that about 5 s in a well stabilized NMR probe at room temperature) and/or the sample has low viscosity and/or the experiment is being carried out at elevated temperatures, then convection is likely to affect the results. The effect of convection is evident as a biexponential decay. In the example below, the fitted curve (fig. 25) does not match the last three points well, suggesting such a problem. A double exponential decay fits better (fig. 26) indicating a T1 closer to 12 s. It is often possible to measure relaxation times of hundreds of seconds in spinning liquid samples.
Fig. 25. Inversion recovery curve with a monoexponential fit. The imperfection in the fit is due to convection. The spectrum is of the methyl protons of ethylbenzene (0.1%) in CDCl3 at 400 MHz at 25°C.
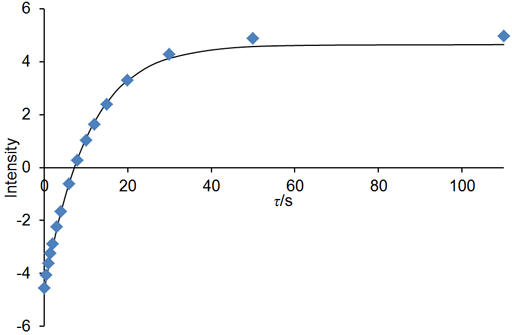
Fig. 26. Biexponential fit to the inversion recovery curve fits much better than the monoexponential fit. The spectrum is of the methyl protons of ethylbenzene (0.1%) in CDCl3 at 400 MHz at 25°C.
Convection effects can be reduced by spinning the sample and using a narrower tube. However, spinning introduces noise that reduces the accuracy of the measurement. So, for short relaxation times, it is better not to spin the sample. For gaseous samples with very long relaxation times, diffusion is also a problem so the measurement should be made in a restricted chamber using the buildup method.
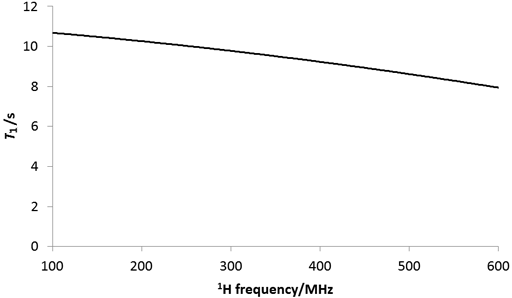
Experimental conditions such as temperature and magnetic field affect the relaxation time. The relaxation time is also magnetic field dependent (fig. 27) so the relaxation time measured on a 300 MHz NMR instrument will be different than that measured on a 600 MHz instrument. In addition, T1ρ is dependent on the spin-lock intensity.
Fig. 27. Effect of magnetic field on the 1H T1 relaxation of water in CDCl3.
Differences within multiplets
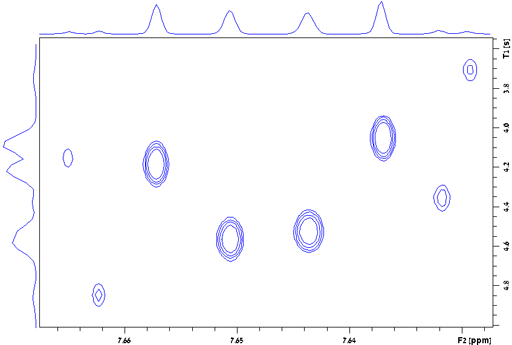
The relaxation of different peaks in a multiplet may be different due to cross-correlation (as shown for the H1 AA'BB' multiplet of diphenylanthracene, fig. 28). For greatest accuracy all the peaks in a multiplet should be measured separately. The above applies to all relaxation measurements: T1, T2, T1ρ and T2*.
Fig. 28. Contour plot for the H1 AA'BB' multiplet of diphenylanthracene in THF-d8 at 400 MHz at 25°C showing T1 values ranging from 3.7 to 4.85 s
Applications of relaxation measurements:
Application of relaxation times to the study molecular motion
The relaxation times for a spin ½ nucleus are approximately related to the correlation time (τc, fig. 29) which is the time that a molecule takes to tumble by one radian (57°). The three relaxation times (T1, T2 and T1ρ) are similar for small diamagnetic molecules in regular (not especially viscous) solvents at room temperature (fig. 30 and left side of fig. 29). Since fig. 29 only approximates the true relaxation time, T2 and T1ρ are sometimes larger than T1 (fig. 30) but never exceed twice its value under normal conditions. For large entities (e. g., protiens or microemulsion droplets) or low temperatures T2 and T1ρ are shorter than T1 (fig. 31 and middle of fig. 29). It is usually impractical for T1ρ to become much larger than T2 (right side of fig. 29) because the motion whould have to be very slow such as in cryogenic solids or the spin-lock would need to be very strong.
Fig. 29. Approximate dependence of relaxation time on correlation time. This diagram is drawn for water (H216O) at 500 MHz with a 26 kHz spin-lock and is within an order of magnitude of being correct for most samples.
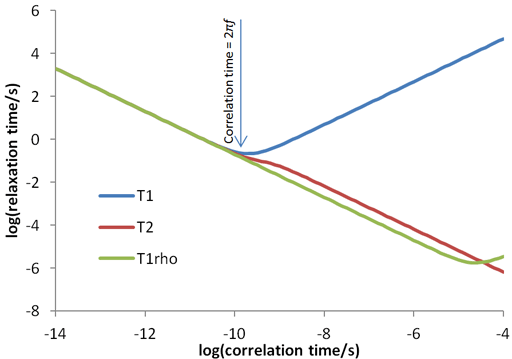
Fig. 30. Relaxation times for a small molecule (2,4-dichloroquinazoline) showing similar values for T1 (red), T2 (blue) and T1ρ (green)
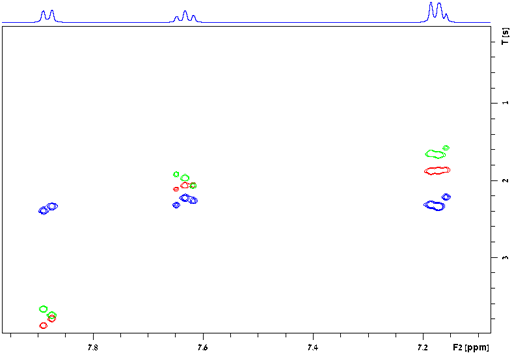
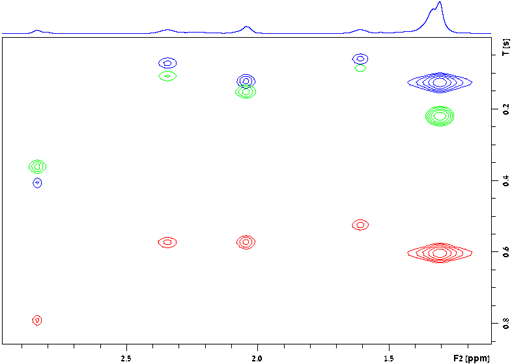
Fig. 31. Relaxation times for large entities (surfactants and oil in the nanodroplets of an O/W microemulsion) showing T1 (red) much longer than T2 (blue) and T1ρ (green)
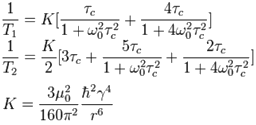
The relaxation times are approximately related to the correlation time by the following equations according to Bloembergen-Purcell-Pound (BPP) theory where ω0 is the rotational frequency of the signal (2πf),µ0 is the magnetic permeability of free space (4π×10−7 H m−1), ħ is the reduced Planck constant 1.054571726×10⁻³⁴ J s, γ is the gyromagnetic ratio of the nucleus (for 1H it is 2.67513×10⁸ rad s−1 T−1) and r is the distance between magnetically active spin-½ nuclei.
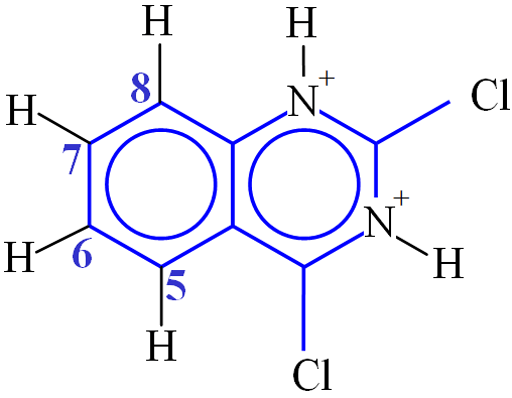
Consider the example of 2,4-dichloroquinazoline (fig. 32). The distance between H5 and H6 is 2.36×10⁻¹⁰ m. The value of K is therefore 1.0×10⁻⁹ s−2. The value of ω02 is 3.14×10⁹ rad s−1. T1 was measured to be 3.8 s (fig. 30). This corresponds to a correlation time of 59 ps (5.9×10⁻¹¹ s). H6 and H7 interact with two protons each so their T1's would be expected to be half of this (1.9 s) and were in reasonable agreement (1.8 and 2.1 s, respectively). H8 has a T1 of 1.9 s instead of the expected 3.8 s due to its proximity to the quadrupolar 14N nucleus. The shorter T1 that indicates proximity to the nitrogen can be used to confirm the assignment. BPP theory predicts that T2 should be the same as T1 for these protons but this is not the case due to spin diffusion. The T2 values all fall between 1.8 and 2.2 s.
Fig. 32. Molecular structure of 2,4-dichloroquinazoline
Consider the example of the microemulsion (fig. 31) where the signals shown arise mainly from the aliphatic chains of Tween80. The signal at 2.84 ppm appears to correspond to a CH signal because of its slower relaxation while the others arise from CH2 signals. The internuclear distance for CH2 is 1.75×10⁻¹⁰ m. The value of K is therefore 6.2×10⁻⁹ s−2. The average T1 of the CH2 signals is 0.62 s and the average T2 is much shorter at 0.12 s. Clearly this is to the right of the minimum T1 in fig. 32. The correlation time that matches this result is 700 ps (7×10⁻¹⁰ s), an order of magnitude slower than the previous example.
Effect of steric hindrance on relaxation
Relaxation is faster when there is steric hindrance due to the proximity of other magnetically active nuclei. In the case of 12,14-ditbutylbenzo[g]chrysene (fig. 33), the relaxation times T1 (fig. 11), T2 (fig. 5) and T1ρ (fig. 23) are shorter by a factor of 2½ for tbutyl14 (0.92 ppm) than for tbutyl12 (1.40 ppm). There is strong steric hindrance on tbutyl14 which puts its protons close to H1 and H2. Given that the correlation time is similar for the two groups, this means that the internuclear distance between methyl protons and H1 and/or H2 is a factor of 1.16 (6√2.5) closer (1.5×10⁻¹⁰ m) than between the methyl protons themselves (1.75×10⁻¹⁰ m). This obvious reduction in relaxation time can be used to assign the NMR signals in sterically hindered portions of the molecule.
Fig. 33. Molecular structure of 12,14-ditbutylbenzo[g]chrysene
![12,14-ditbutylbenzo[g]chrysene](../../2d/assigndtbbgc_files/dtbbgc.gif)
Effect of dissolved air and other paramagnetic species
The relaxation time can be used to detect complexation with paramagnetic species. This is so sensitive that the effect of dissolved oxygen from the air that speeds up relaxation even in the normal concentrations found in solution. This need not be important if the relaxation measurement is a means to another end, such as spectroscopic assignment. However, when the main purpose of the measurement is to determine the relaxation properties of a compound or to determine the correlation time, the sample must usually be degassed with an inert gas or sealed under vacuum.
The paramagnetic effect of oxygen is linearly related to the
pressure: ![T1=1/[(1/T1vacuum)+kP]](t1t2_files/oxygeneq.gif) .
The value of k is typically 0.06 s/atm of air but is higher
when there is stronger than usual binding between the molecule and
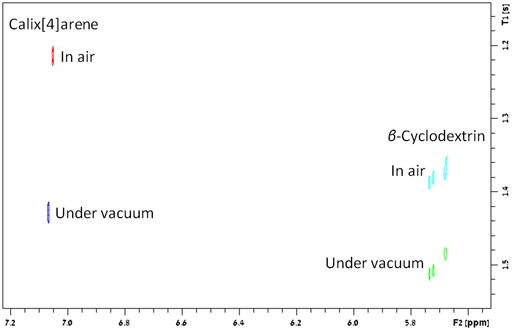
oxygen. This is the case for β-cyclodextrin but for
calix[4]arene value of k is around 0.13 for the non-polar
part of the molecule (fig. 34), indicating weak binding to molecular
oxygen.
.
The value of k is typically 0.06 s/atm of air but is higher
when there is stronger than usual binding between the molecule and
oxygen. This is the case for β-cyclodextrin but for
calix[4]arene value of k is around 0.13 for the non-polar
part of the molecule (fig. 34), indicating weak binding to molecular
oxygen.
Fig. 34. Difference between the effect of oxygen on relaxation times of β-cyclodextrin and calix[4]arene. The larger difference for calix[4]arene indicates weak binding to oxygen.
Relaxation weighting for assignment
Although the relaxation time is a property of the nucleus that reflects its properties and environment, it is mostly used to decide on the length of the relaxation delay between acquisitions. For quantitative work this needs to be at least five times T1 to achieve a 1% accuracy although seven times T1 is recommended to ensure accuracy. For maximum (non-quantitative) sensitivity within a limited time for a regular 1D experiment, the repetition rate should be T1 with a pulse angle of 68°. The mixing time in NOESY and EXSY experiments is dependent on T1 while the mixing time in ROESY and TOCSY is dependent on T1ρ. In principle, the preferred acquisition time is dependent on T2* although in practice this is determined by observing the fid directly.
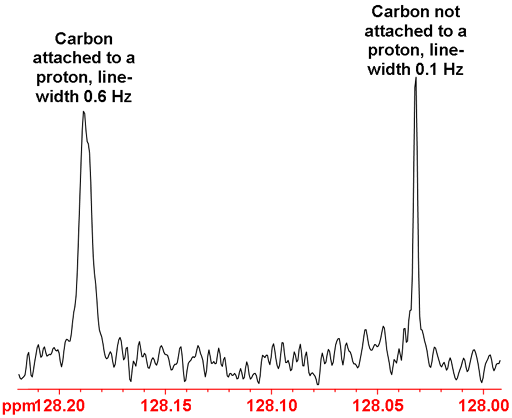
Relaxation times can be used for assignment. In general, relaxation is faster when signals are strongly coupled or close to quadrupolar nuclei. For example, quaternary carbons (not attached to protons) relax slower than carbons attached to protons. This can be easily observed in the 13C NMR because the slower relaxing nuclei give sharper signals as shown in fig. 35 below.
Fig. 35. Part of the 13C NMR spectrum of 12,14-ditbutylbenzo[g]chrysene showing the difference between proton attached and non-proton attached carbons
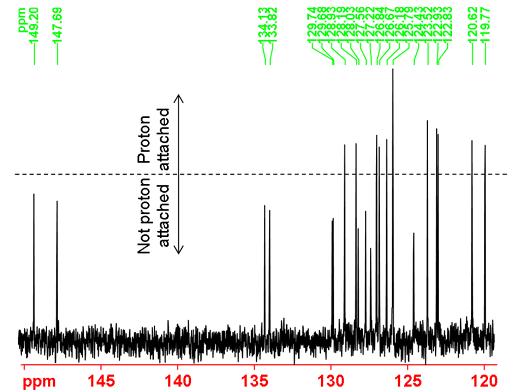
Under usual 13C NMR acquisition (not overlong relaxation delay) and processing (exponential apodization with 1 Hz line broadening) conditions as shown in the spectrum below (fig. 36), the carbons attached to protons appear higher than those not attached to protons due to the difference in relaxation times in addition to NOE factors. This is the spectroscopic equivalent to the T1 weighting technique used in magnetic resonance imaging (MRI).
Fig. 36. Aromatic Part of the 13C NMR spectrum of 12,14-ditbutylbenzo[g]chrysene
Exchange processes
Dynamic exchange processes reduce the relaxation time, be it chemical or conformational exchange. This is especially significant for medium-fast exchange on a timescale of milliseconds to seconds. The T2 relaxation time is related to and can be used to determine the exchange rate and consequently the thermodynamic free energy of activation (ΔG‡). Using measurements at several temperatures, the activation enthalpy and entropy can also be determined. However, it is very time consuming to measure T2, so the value of T2* is usually measured from the line-widths and used instead. For more details see the page on dynamic NMR.