Diffusion NMR
Use our NMR service to measure diffusion.
Diffusion NMR experiments resolve different compounds spectroscopically in a mixture based on their differing diffusion coefficients, depending on the size and shape of the molecules. Diffusion NMR may be used to resolve otherwise intractable spectra of mixtures or it may be used to determine the size of molecules and aggregates, determining the degree of polymerization, size of a solvation shell or other microscopic structure. The spectra produced resemble chromatograms is some respects while also providing NMR information that can be used for assignment of individual components. For most mixtures though, the resolution is not sufficient for assignment and NMR chromatography techniques need to be applied.
What you should already know before continuing to read this:
Before you continue reading about diffusion NMR, you should have some knowledge of:
To understand the section on 3D-DOSY, you should have some knowledge of:
If you want to read about these subjects first, please go to the links above.
Diffusion NMR
The diffusion NMR technique is often referred to as Self-Diffusion (SD)-NMR or Diffusion Ordered SpectroscopY (DOSY). This is achieved by combining radio-frequency pulses as used in routine NMR spectroscopy with magnetic field gradients that encode spatial information.
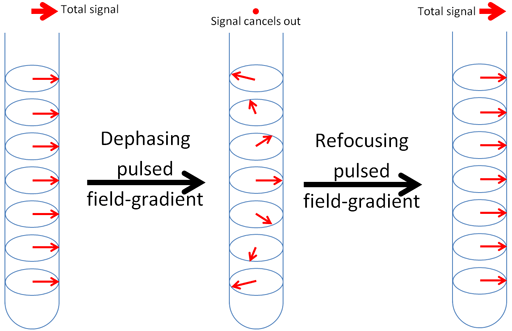
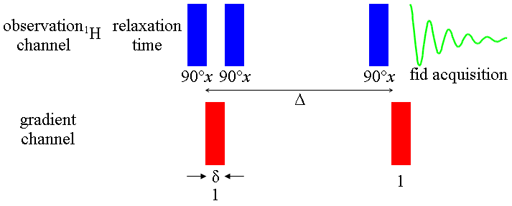
In the simplest form of the pulsed gradient diffusion experiment (more sophisticated experiments will be described later), called the pulsed field gradient echo (PGSE, fig. 1), the magnetization is excited with a 90° radiofrequency pulse then dispersed using a magnetic field gradient pulse. After a period of Δ/2 a 180° radiofrequency pulse inverts the dispersed magnetization such that after a period of Δ the magnetization is the negative of what it was following the gradient pulse. At this point, a second gradient pulse is applied to refocus the signal (fig. 2).
Fig. 1. Pulse sequence for gradient PGSE
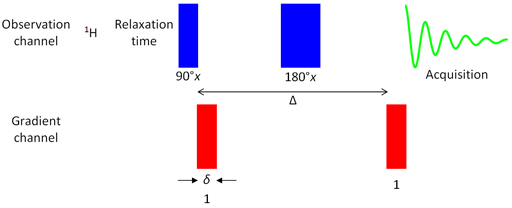
Fig. 2. Effect of a magnetic field gradient pulse. The magnetization vector is rotates differently at different positions in the tube cancelling out the total signal. A refocusing gradient pulse can make the total signal reappear depending on its sign and intervening rf pulses.
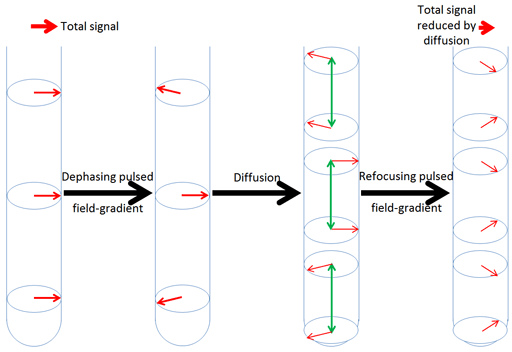
Refocusing is only achieved for those nuclei that have not moved significantly up or down the tube. Diffusion causes some of the nuclei to move away from where their signals can be refocused thereby reducing the intensity of the resulting signal (fig. 3).
Fig. 3. Effect of diffusion combined with magnetic field gradient pulses. The physical movement of nuclei reduces the effectiveness of the refocusing pulse reducing the resulting signal strength.
The more intense and the longer the magnetic field gradient pulse, the more spatially selective it is (fig. 4) and the weaker the resulting signal. The intensity and duration of the magnetic field gradient pulse determine the distance that a nucleus can diffuse and still yield a signal.
Fig. 4. The effect of magnetic field gradient strength on signal strength is like focusing on the molecules that have not diffused out of range. The stronger the gradient the smaller the range and the weaker the gradient the larger the range.

The pulse sequence is repeated, many (we usually use 32) times incrementing the gradient strength (fig. 5) and keeping the delays
constant. A plot made of intensity against gradient strength (fig. 6). The intensity,
I, is proportional to ![exp[-(gammagdelta)^2D(DELTA-delta/3)]](diff_files/eq1.gif) where γ is the gyromagnetic ratio (4257 s-1 G-1
for proton), g is the gradient strength, δ and Δ are delays and
D is the diffusion constant. The diffusion constant can be extracted either using a non-linear curve fit to
the resulting Gaussian decay. In this case the curve is proportional to
where γ is the gyromagnetic ratio (4257 s-1 G-1
for proton), g is the gradient strength, δ and Δ are delays and
D is the diffusion constant. The diffusion constant can be extracted either using a non-linear curve fit to
the resulting Gaussian decay. In this case the curve is proportional to  . Therefore
  and the diffusion constant can be calculated as follows:

Fig. 5. Diffusion spectrum. The peak on the left decays faster with increasing gradient strength and has a higher diffusion constant than the peaks on the right.
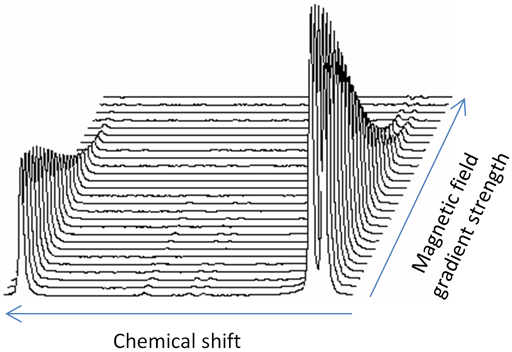
Fig. 6. Gaussian fit to diffusion peak intensity using a non-linear fit
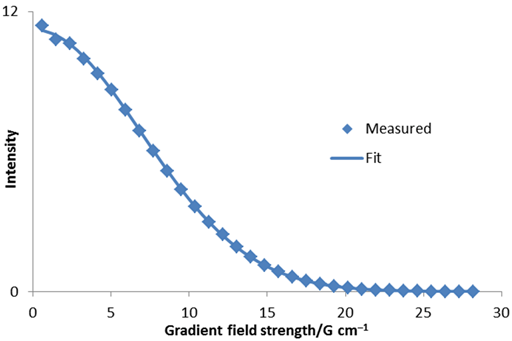
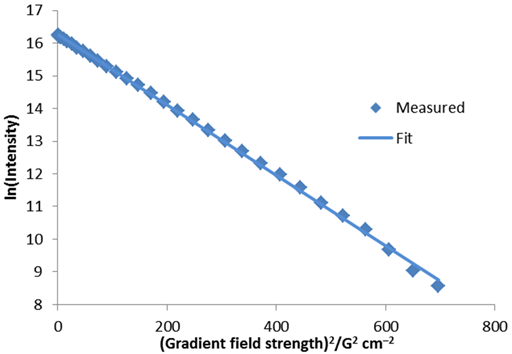
The diffusion rate can also be calculated by a linear fit to ln(I) versus g2 (fig. 7). In this case, a value of 3.13 × 10⁻⁹ m2 s–1 is obtained. This is very similar and easier to calculate but less accurate than the non-linear fit because the points are not evenly distributed and the accuracy of ln(I) is not the same for each point.
Fig. 7. Linear fit to diffusion peak intensity
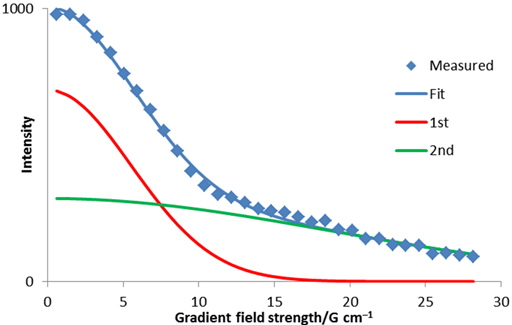
Often signals overlap or arise from multiple environments. In such cases, a bigaussian or polygaussian decay results. This can be analyzed using a non-linear fit and does not lend itself to linear analysis. In fig. 8 the red and green Gaussian curves add to fit the experimental data.
Fig. 8. Bigaussian fit to diffusion peak intensity using a non-linear fit
In order to derive the diffusion constants, a non-linear inversion of the Laplace transform (ILT) may be applied to extract
the Gaussian decay constants. The decay constants are divided by  and are customarily plotted on a logarithmic scale (fig. 9) to make them clearer because
diffusion rates typically vary by a few orders of magnitude.
Fig. 9. ILT of a bigaussian decay converted to diffusion constants and plotted on a logarithmic scale
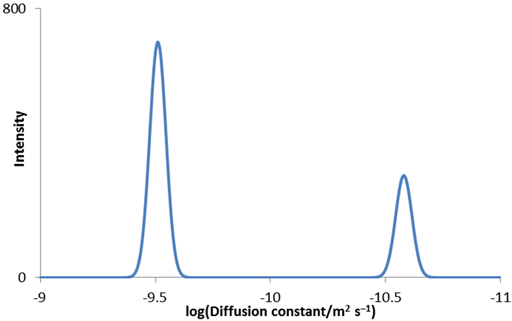
Diffusion spectra are usually presented as a 2D plot with chemical shift on the horizontal axis and log(Diffusion constant) on the vertical axis (fig. 10). This representation is called Diffusion Ordered SpectroscopY (DOSY). The acquisition dimension is easily analyzed by a Fourier transform yielding high resolution in the frequency domain. However, analysis of the diffusion dimension involves an inversion of the Laplace transform (ILT). While this is quite accurate at up to 2% for a single decay, it has very low resolution when separating two or more overlapping signals with little chance of resolving diffusions of signals that have overlapping frequencies that differ by less than 30–50%.
Fig. 10. DOSY spectrum of norcamphor and β-cyclodextrin in DMSO-d6
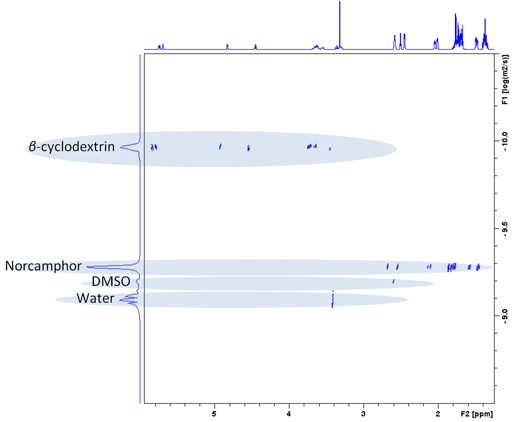
Each slice of the DOSY spectrum corresponds to the regular NMR spectrum of one component (fig. 11). The diffusion rate of the components can be read of the DOSY spectrum (fig. 10 and table 1).
Fig. 11. Individual spectra extracted from a DOSY spectrum of norcamphor and β-cyclodextrin in DMSO-d6

Table 1. Diffusion rates measured from the DOSY spectrum of norcamphor and β-cyclodextrin in DMSO-d6
| Compound | Log(D/m2 s–1) | D/m2 s–1 |
|---|---|---|
| Water | –9.09 | 8.1 × 10⁻¹⁰ |
| DMSO-d5 | –9.20 | 6.4 × 10⁻¹⁰ |
| Norcamphor | –9.28 | 5.2 × 10⁻¹⁰ |
| β-Cyclodextrin | –9.87 | 1.4 × 10⁻¹⁰ |
Size measurement using diffusion
The self-diffusion constant is measured in m2 s-1 and is larger for smaller molecules and less viscous solvents than it is for large molecules and viscous media (fig. 12). For example, at 25°C the self-diffusion constant of water is 2.299 × 10⁻⁹ m2 s-1. For the less viscous acetone, it is 4.57 × 10⁻⁹ m2 s-1 while for the more viscous and larger octan-1-ol it is 1.4 × 10⁻¹⁰ m2 s-1. Our equipment enables us to diffusion constants in the range 10-7 to 10-14 m2 s-1. The molecular size can be estimated from the Stokes-Einstein equation, where r is the van der Waals radius of the molecule in meters, k is the Boltzmann constant (1.380 × 10⁻²³ J K-1), T is the temperature in Kelvin, η is the viscosity of the solution in Pascal seconds (Pa s = 1000 centipoises) and D is the self-diffusion constant. For example, the self-diffusion constant of 9,10-diphenylanthracene in THF-d8 at 25°C is 1.04 × 10⁻⁹ m2 s-1 and the viscosity is 0.501 mPa s. Applying the Stokes equation, the radius is calculated to be 0.42 nm, comparing well with the measured mean van der Waals radius of 0.41 nm.
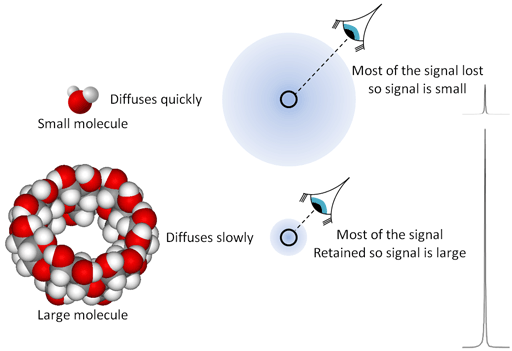
Fig. 12. The effect of diffusion rate on signal strength is like focusing on the molecules that have not diffused out of range. Small molecules diffuse quickly leaving few nuclei that refocus while large molecules diffuse slowly leaving more nuclei in place yielding a stronger signal.
Stokes-Einstein equation 
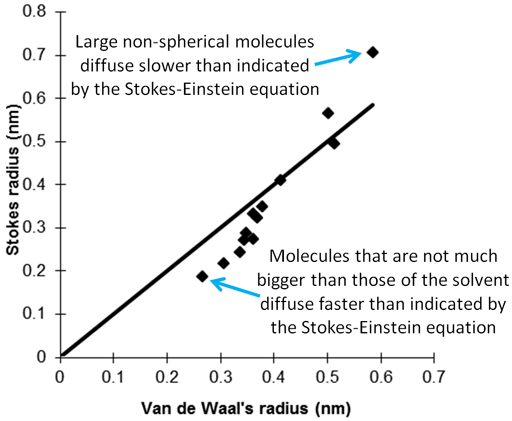
However, the Stokes-Einstein equation assumes spherical molecules much larger than the solvent molecules. Small molecules diffuse faster than expected while large planar molecules diffuse slower than expected. In the above case, the small size of the molecule relative to THF-d8 is counteracted by its planarity giving a near perfect result (fig. 13). In ionic solutions, the effective diffusion radius is extended by a solvent shell becoming significantly larger than the van der Waals radius.
Fig. 13. Comparison of the molecular size calculated from the Stokes-Einstein equation with the van der Waals radius
R. E. Hoffman, et al., J. Chem. Soc. Perkin 2, 1998, 1659-1664.
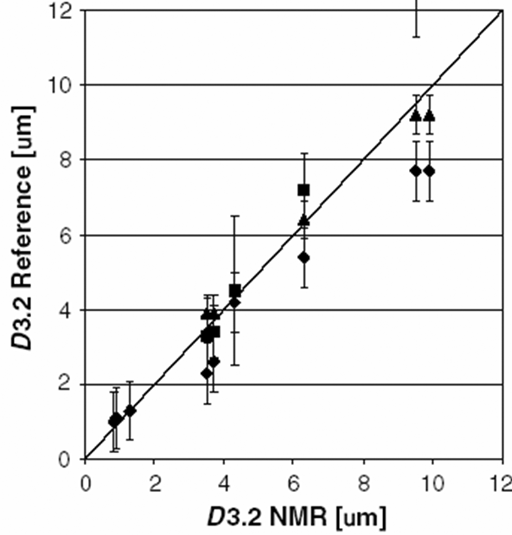
Stokes-Einstein equation can be more successfully applied to larger entities such as micelles that are usually spherical (fig. 14). However, if there is a significant difference in magnetic susceptibility inside and outside the droplets, the magnetic field of the spectrometer will distort the micelles and the diffusion rate will vary with gradient direction.
Fig. 14. Comparison of the emulsion droplet size calculated from the Stokes-Einstein equation with that determined by other methods
J.P.N. Duynhoven, et al., Magn. Reson. Chem., 2002, 40, S51-S59.
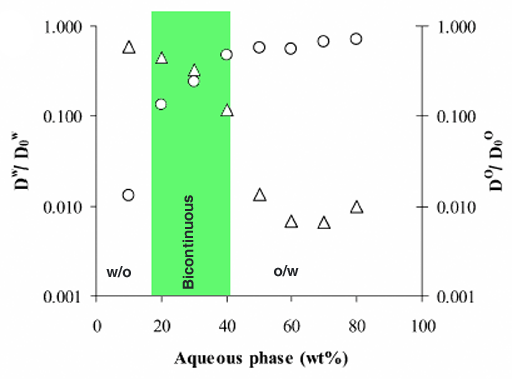
Another use for diffusion is the study of phase mobility in complex liquids. For example, an emulsion of oil and water can exist in three states: water in oil (W/O), bicontinuous or oil in water (O/W). A substrate that is hydrophilic (i. e., dissolves better in water) will diffuse much faster in an O/W or bicontinuous emulsion than in a W/O emulsion. Conversely, a substrate that is hydrophobic (i. e., dissolves better in oil) will diffuse much faster in an W/O or bicontinuous emulsion than in a O/W emulsion. A combination of the diffusion constants of both species indicates the state of the emulsion (fig. 15).
Fig. 15. Diffusion constants of substrates in water (circles) and oil (triangles) as a function of dilution used to differentiate three emulsion states: W/O, bicontinuous and O/W
A. Spernath, et al., J. Agric. Food Chem., 2003, 51, 2359-2364.
3D-DOSY
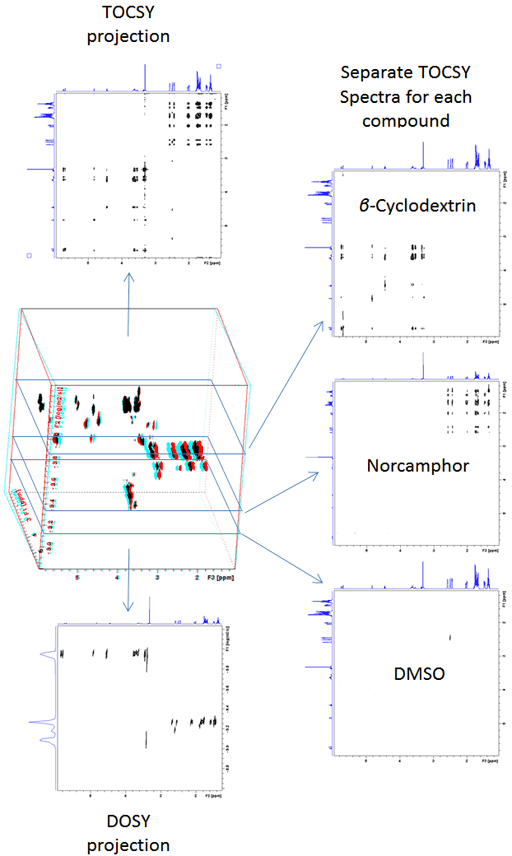
Diffusion spectra can be combined with any 2D technique in order to separate 2D spectra in the diffusion dimension. The advantage is that there is greater dispersion of the signals reducing the need to resolve overlapping signals in the diffusion dimension, thereby increasing the accuracy of the diffusion measurement. For example, a DOSY-TOCSY is a 3D spectrum (fig. 16) whose projections are DOSY and TOCSY spectra while its slices are individual TOCSY spectra of each molecule (fig. 17).
Fig. 16. 3D-DOSY-TOCSY spectrum of a mixture of β-cyclodextrin, norcamphor in DMSO-d6
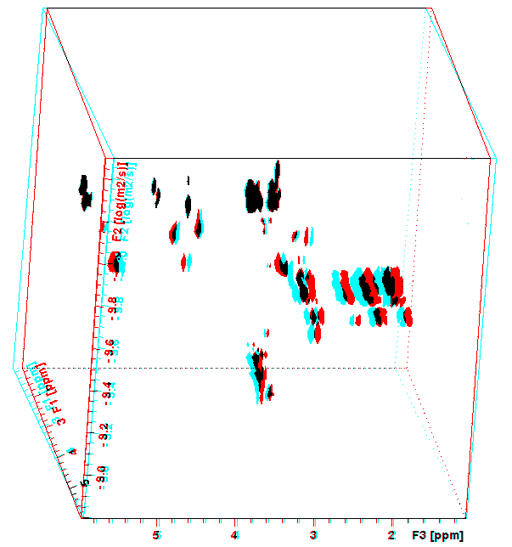
To see this figure correctly place a red filter of the left eye and a cyan filter over the right eye.
Fig. 17. Projections and slices of a 3D-DOSY-TOCSY spectrum of a mixture of β-cyclodextrin, norcamphor in DMSO-d6
Heteronuclear correlation (in this case HSQC) between 1H and 13C has the advantage of greatly increased dispersion along the 13C axis that reduces the adverse effects of overlap when combined with DOSY (Fig. 18). However, the low isotopic abundance of 13C reduces sensitivity. Nonetheless, for concentrated samples, excellent resolution compounds (fig. 19) outweighs the sensitivity issue.
Fig. 18. DOSY-HSQC spectrum of a mixture of β-cyclodextrin and norcamphor in DMSO-d6
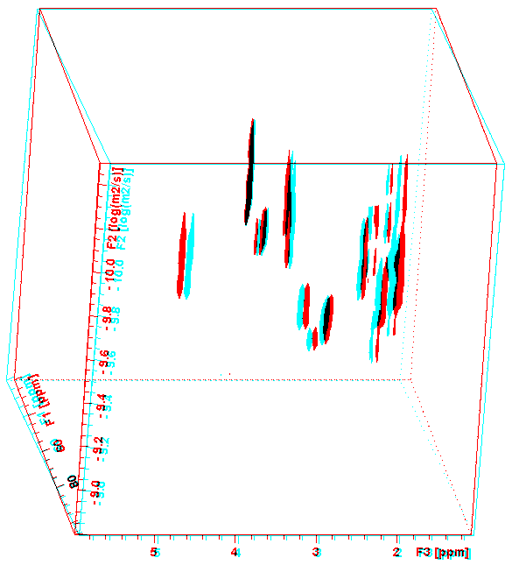
To see this figure correctly place a red filter of the left eye and a cyan filter over the right eye.
Fig. 19. Projections and slices of a DOSY-HSQC spectrum of a mixture of β-cyclodextrin and norcamphor in DMSO-d6
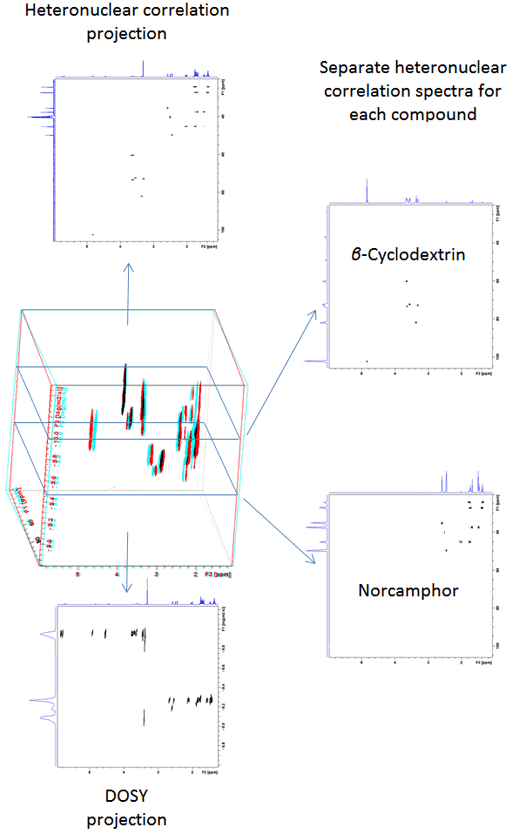
DOSY can be also combined with other 2D NMR methods such as COSY, NOESY and ROESY.
Experimental conditions and methods
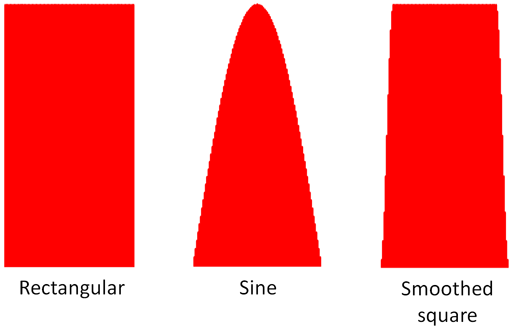
For best results care must be taken that the gradients are shielded and that the pre-emphasis is correctly adjusted to yield a pulse of the expected shape, that the temperature is stable and that thermal convection is not occurring. Although the shape of the magnetic field gradient pulses (fig. 20) in the diagrams is rectangular, the sudden gradient switching causes artifacts. Sine shaped pulses are commonly used although they are about a third less intense. A compromise between smoothness is the smoothed square pulse that may be necessary for measuring slow diffusion. If the experimental conditions are not set up carefully, the decay curve will look decidedly ungaussian and even wavy and the diffusion rate will appear faster than it should. Sensitivity will be lost and the wrong value of the diffusion constant will be obtained.
Fig. 20. Magnetic field gradient pulse shapes
There are four main methods used for such measurements: Pulsed Gradient Spin Echo (PGSE), Pulsed Field Gradient Stimulated Spin Echo (PFG-SSE or PFG-STE), bipolar pulse longitudinal eddy current delay (BPP-LED) and asymmetric bipolar PFG-SSE that is popularly referred to as 'oneshot' because for technical reasons it can be acquired more quickly than the others.
PGSE (fig. 1 above) is the simplest pulsed field gradient NMR method or measuring diffusion and best suited to spectra consisting only of singlets where the transverse relaxation (T2) is not much faster than the longitudinal relaxation (T1).
In most cases, T2 is much shorter than T1 and PFG-SSE (fig. 21) yields much more sensitivity than PGSE even though half the theoretically available signal is lost. When the spectrum contains multiplets, PGSE severely distorts them so PFG-SSE is a must. The pulse sequence first excites the magnetization then disperses its phase with a magnetic field gradient pulse. A second radiofrequency pules is applied that moves half of the dispersed magnetization onto the z-axis. After a delay that allows diffusion to occur, a third radiofrequency pulse returns the dispersed magnetization to the x,y-plane where a final magnetic field gradient pulse refocuses it to yield a signal whose intensity is dependent on the diffusion rate.
Fig. 21. Pulse sequence for gradient PFG-SSE
For gradient systems such as ours (Bruker DRX 400 with BGU II gradient unit) that lack a B0 compensation unit, bipolar pulses and eddy current reduction dramatically reduce the required phase cycling and improve the line-shape. Therefore, we use BPP-LED (fig. 22). However, for very strong gradient pulses, artifacts such as waviness in the decay curves may occur and a fully phase-cycled PFG-SSE may be required to yield an accurate result. Bipolar gradient pulses consist of two opposing gradient pulses separated by a 180° radiofrequency pulse. This has the same effect on the magnitude of the NMR signal as a single magnetic field gradient pulse but cancels out temporary perturbations in the overall magnetic field improving spectra resolution. The LED sequence adds two pulses at the end, the first moves the magnetization onto the z-axis and the second returns it to the x,y-plane a few milliseconds later, effectively storing the signal while any eddy-currents decay.
Fig. 22. Pulse sequence for gradient BPP-LED

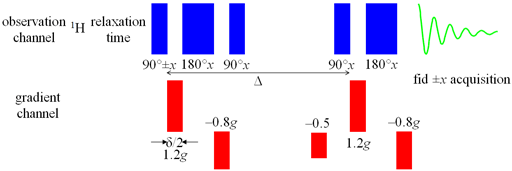
On our 500 MHz spectrometer, there is better gradient shielding and we use the oneshot sequence (fig. 23) which is an asymmetric bipolar PFG-SSE experiment. A combination of asymmetric pulses and spoil gradients (applied while the magnetization is on the z-axis so as not to affect it) reduces the number of pulses required to obtain reliable results.
Fig. 23. Pulse sequence for oneshot
Convection in a regular 5 mm NMR tube is commonly observed at room temperature for low-viscosity solvents such as acetone and methanol or for other systems at elevated temperatures. Convection moves molecules in a different way than diffusion distorting the Gaussian decay. One solution is to use narrower (3 to 4 mm outer diameter, 0.85 to 2 mm inner diameter) regular Pyrex tubing containing the sample inserted into a 5 mm NMR tube. The narrower tube suppresses convection and we often use 4 mm outer diameter (2 mm inner diameter) tubes inside 5mm NMR tubes.
Convection compromises measurements of slow diffusion more than fast diffusion. For diffusion rates less than 10-11 m2s–1 it is necessary to use a convection compensated sequence (fig. 24), even if no convection is apparent, in order to obtain accurate results. The disadvantage of this sequence is that it retains only a quarter of the signal because it uses a double gradient echo.
Fig. 24. Pulse sequence for convection-compensated oneshot

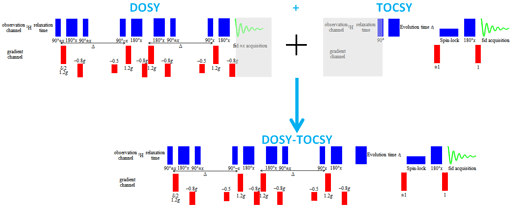
3D-DOSY pulse sequences are made by replacing the first pulse of a 2D pulse sequence (such as TOCSY) with the DOSY sequence (fig. 25).
Fig. 25. Combination of pulse sequences to make a 3D-DOSY-TOCSY sequence. The greyed regions of the DOSY acquisition and the first pulse of the TOCSY sequence are elimination when combined.
