Short-range heteronuclear correlation
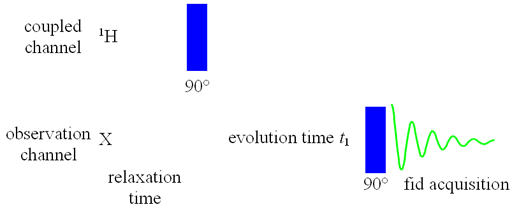
Heteronuclear correlation is used to assign the spectrum of another nucleus once the spectrum of one nucleus is known. It may also be of help in assigning the spectra of both nuclei even when a partial assignment of one or both is available. For small molecules, 1H is usually correlated with 13C while for biomolecules, 1H is also commonly correlated to 15N. Correlation to other nuclei such as 29Si is also possible. The experiment may also provide chemical information which the spectra of neither nucleus can provide alone. In principle, heteronulcear correlation can be achieved using a two pulse sequence (fig. 1) and can be observed for the non-proton (X) nucleus. However, sensitivity is greatly improved by various methods including double INEPT, inverse detection, gradient selection and decoupling. As a result, one of a variety of pulse sequences that is best suited for a particular application is used instead of the two-pulse sequence in fig. 1.
Fig. 1. Pulse sequence for basic heteronuclear correlation
Here we discuss the class of experiment for large short-range heteronuclear couplings which usually arise from one-bond interactions, e.g., 1H-13C or 1H-15N. Long-range heteronuclear correlation is discussed elsewhere. There are seven common pulse sequences for this experiment that are best suited for different conditions: HSQC (Heteronculear Single Quantum Coherence), HSQCSI (Heteronuclear Single Quantum Coherence Sensitivity Improved), HSQCSIsp (HSQCSI with one additional shaped pulse), HSQCSIsp2 (HSQCSI with two additional shaped pulses), HMQC (Heteronuclear Multiple-Quantum Coherence), HMQCSIsp (Heteronuclear Multiple Quantum Coherence Sensitivity Improved with an additional shaped pulse) and short-range HMBC (Heteronuclear Multiple Bond Coherence adapted for one-bond correlations).
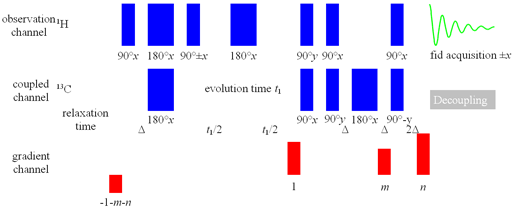
The best sequence for most small-molecule work is also the most complicated: the HSQCSIsp2 (fig. 2). This is based on the HSQC sequence with the addition of a second quantum pathway for sensitivity improvement (SI) and shaped pulses to improve the pureness of the phase but takes more time allowing signal loss due to relaxation and suppresses the 'useful artifact'. Therefore, the SI should only be applied if the 1H line-width is less than 20 Hz for 1H-13C and 12 Hz for 1H-15N. Note that the 14NH line-width is usually broader than the 15NH line-width needed for deciding which technique to use. The 15NH line-width can be measured from the 15N satellites of the NH signal. If the 13C spectral width is less than 60 ppm or the 15N spectral width is less than 90 ppm or the 1H line-width is greater than that suitable for SI, the addition of shaped pulses does not improve the spectrum enough to overcome the losses they cause in sensitivity. Only one pair of shaped pulses should be applied if 1H line-width is greater than 10 Hz.
Fig. 2. Pulse sequence for HSQC variants

The sequence as drawn is that for HSQCSI. Omit the sky blue components for HSQC. Use shaped pulses for the first two 180°X pulses for HSQCSIsp and all the 180°X pulses for HSQCSIsp2. Parameters for the pulse sequence are listed in table 1.
Table 1. Gradient ratios and coupling constants for HSQC and HMQC
| X nucleus | nHSQC | nHMQC | JAX |
|---|---|---|---|
| 13C | 3.98 | 1.2515 | 145 Hz |
| 15N | 9.86 | 1.1014 | 80 Hz |
If the digital resolution without zero-filling of the spectrum in f1 (13C, 15N, etc. direction) is coarser than 8 Hz then HMQC (fig. 3) gives greater sensitivity than HSQC. If the f2 (1H direction) resolution is less than 10 Hz for 1H-13C or 6 Hz for 1H-15N use HMQCSIsp variant.
Fig. 3. Pulse sequence for HMQC
Short-range HMBC should only be used as a last resort when 1H line-widths are greater than 40 Hz for 1H-13C and 30 Hz for 1H-15N).
Δ should be 1/(4JAX) where JAX is the coupling constant. For 1H-13C the coupling constant is approximately 125 Hz for sp3 and 160 Hz for sp2 (table 1). For 1H-15N the coupling constant is approximately 80 Hz. The gradient strength m should not be a simple multiple of the other gradient strengths.
The peaks for short-range (one-bond) correlation are pure phase and positive for all the experiments except short-range HMBC (see figure for long-range correlation) that has a complex phase structure in f2 and is best process as a magnitude spectrum in that direction.
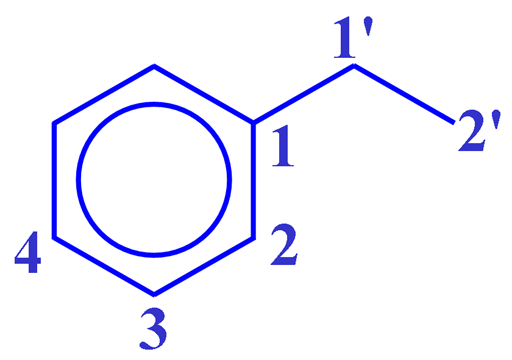
The correlation experiment does not contain a diagonal, unlike most homonulcear experiments. Each proton signal is correlated with a carbon signal. For example in the spectrum (fig. 4) H2' of ethylbenzene (fig. 5) at 1.24 ppm correlates with C2' at 15.69 ppm and H1' at 2.65 ppm correlates with C1' at 28.97 ppm. Those signals in the 1D spectrum that do not correlate do not appear in the 2D spectrum.
Fig. 4. 2D HSQCSI spectrum of ethylbenzene
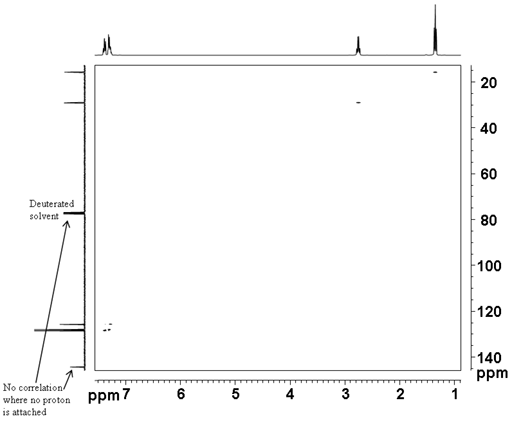
Fig. 5. Structure of ethylbenzene
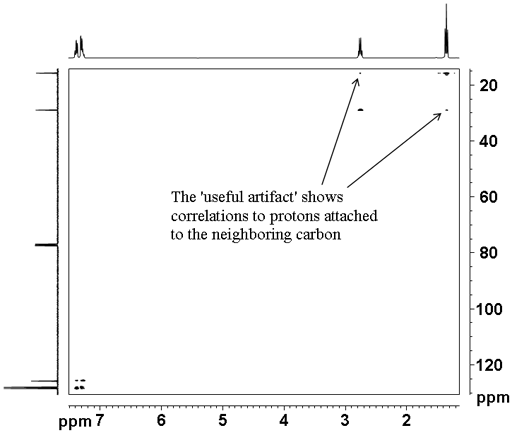
The heteronuclear correlation experiments suffer from t1 noise artifacts that appear as vertical streaks in the spectrum. In addition HSQCSI suffers from a 'useful artifact' (fig. 6) where weak correlations are seen to protons coupled to the proton attached to the carbon. This can be useful when there is strong overlap in the proton spectrum allowing advantage to be taken of the dispersion of the 13C chemical shift. The use of shaped pulses suppresses the 'useful artifact' so hard pulses should be used if one wishes to observe the 'useful artifact'. For an example of the use of the 'useful artifact' see the assignment of cholseteryl acetate.
Fig. 6. 2D HSQCSI spectrum of ethylbenzene showing the 'useful artifact'
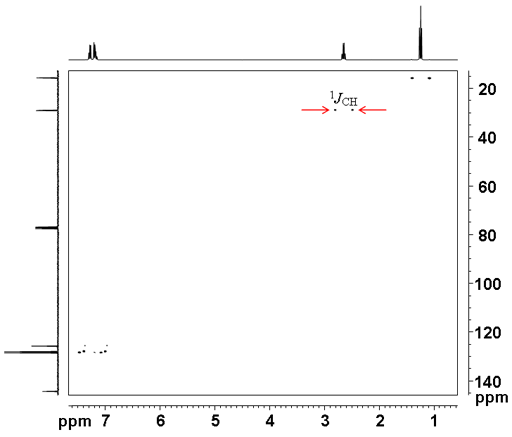
The 1H-13C coupling constant can be measured by not using coupling (fig. 7). This has the advantage over the 1D carbon coupled spectrum in that the doublets do not overlap.
Fig. 7. Coupled 2D HSQCSI spectrum of ethylbenzene
The HQSCSI correlation spectrum (fig. 8) for 12,14-ditbutylbenzo[g]chrysene (fig. 9) clearly separates the aliphatic and aromatic regions. From the 1H spectrum, the proton attached carbons in the 13C spectrum are assigned, starting with the tbutyls. Their assignment confirms the assumption that tbu14 yields a wider peak than tbu12. The HMQC spectrum (fig. 10) gives the same result but is slightly weaker because the f1 resolution is not low.
Fig. 8. 2D HSQCSI spectrum of 12,14-ditbutylbenzo[g]chrysene
![HSQCSI of 12,14-ditbutylbenzo[g]crysene](hetcor_files/dtbbgchsqcsi.gif)
Fig. 9. 12,14-ditbutylbenzo[g]chrysene
![12,14-ditbutylbenzo[g]crysene](hetcor_files/dtbbgc.gif)
Fig. 10. 2D HMQC spectrum of 12,14-ditbutylbenzo[g]chrysene
![HMQC of 12,14-ditbutylbenzo[g]crysene](hetcor_files/dtbbgchmqc.gif)
The 13C resolution is a limiting factor in the two spectra above. This can be resolved by acquiring the spectrum over a restricted 13C range (fig. 11). However, signals falling outside the region of interest fold, are out of phase, may not be completely decoupled in the horizontal direction and have reduced sensitivity. Nonetheless, the resolution in the vertical (f1) direction is dramatically improved without increasing the acquisition time.
Fig. 11. 2D HSQCSI spectrum over a restricted range of 12,14-ditbutylbenzo[g]chrysene
![HSQCSI over a restricted range of 12,14-ditbutylbenzo[g]crysene](hetcor_files/dtbbgcrestricted.gif)
The aromatic region (fig. 12) can then be used to assign all the proton-attached carbons.
Fig. 12. 2D HSQCSI spectrum of the aromatic region of 12,14-ditbutylbenzo[g]chrysene
![HSQCSI of the aromatic region of 12,14-ditbutylbenzo[g]crysene](hetcor_files/dtbbgcaromatic.gif)
The heteronuclear coupling constants can be measured from the coupled HSQCSI spectrum (fig. 13).
Fig. 13. Coupled 2D HSQCSI spectrum of 12,14-ditbutylbenzo[g]chrysene
![Coupled HSQCSI of 12,14-ditbutylbenzo[g]crysene](hetcor_files/dtbbgccoupled.gif)
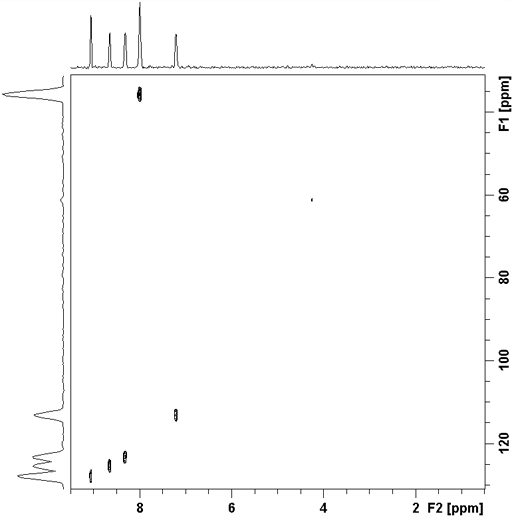
Short-range HMBC is used for broad signals that would otherwise decay into the noise during the pulse sequence. The spectrum is not phase-sensitive and not decoupled in f2. Fig. 14 shows the short-range HMBC of gramicidin (fig. 15) even though, its signals are narrow enough to use regular HSQCSIsp2.
Fig. 14. Short-range HMBC spectrum of gramicidin
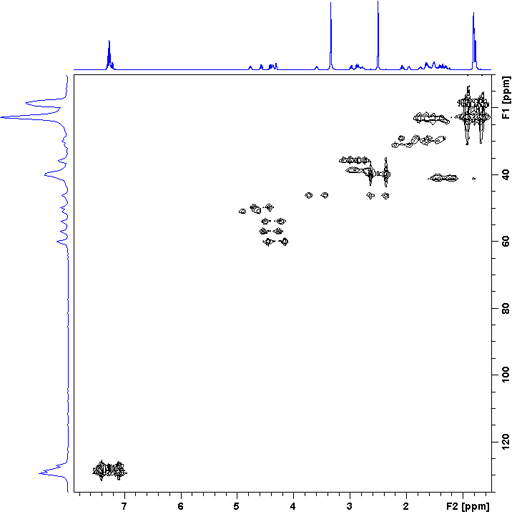
Fig. 15. Sturcture of gramicidin
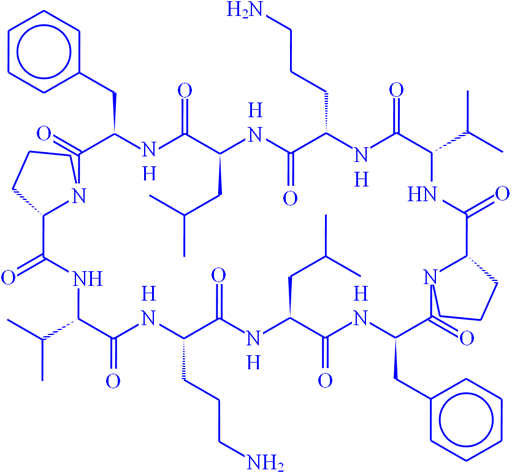
HSQC is applied to 1H-15N in the same way as shown above for 1H-13C. Fig. 16 shows the 1H-15N HSQCSIsp2 spectrum of gramicidin.
Fig. 16. 1H-15N HSQCSIsp2 spectrum of gramicidin
