2D assignment of cholesteryl acetate
Here we will interpret the 1H and 13C NMR spectrum of an example molecule: cholesteryl acetate (C29H48O2, fig. 1) in CDCl3. The molecule chosen yields complex 1H and 13C-NMR spectra and 2D techniques are ideal for its interpretation. The 1H spectrum contains many overlapping second order multiplets including several of the type ABCDEF. This makes analytical treatment of the coupling patterns impossible. However, the chemical shifts and some of the coupling constants can be determined by 2D-NMR.
Fig. 1. Molecular structure of cholesteryl acetate

A partial assignment is possible without resorting to 2D methods. The 1H-NMR spectrum (fig. 2) shows a multiplet at 5.37 ppm, the only signal in the vinyl region corresponding to the only vinyl proton in the molecule, H6. The multiplet (AX2Y2) at 4.60 is the only signal in the region where HCO units are expected and the only such unit in the molecule is H3. There are three methyls expected to couple to another proton: H21, 26 and 27. H26 and 27 are isopropyl in nature and therefore expected to have very similar chemical shifts, provisionally 0.860 and 0.863 ppm. H21 is therefore provisionally at 0.91 ppm. The remaining three methyls are singlets. One falls at 2.03 ppm which is typical of an acetyl methyl, H29 while the other two (H18 and H19 not necessarily in that order) fall at 0.68 and 1.02 ppm). The remaining 28 protons are in the region 0.9 to 2.4 ppm. This is as far as a 1D proton assignment can reasonably go.
Fig. 2. 1H-NMR spectrum of cholesteryl acetate in CDCl3

In the COSY spectrum (figs. 3, 4) we can start from four possible positions, H3, H6, H21 and H26-27 that have already been assigned. H3 correlates with H4 and H2. H4 does not correlate further through three bonds and can be assigned to 2.32 ppm (or more preciselay H4A at 2.33 ppm and H4B at 2.30 ppm) with integral 2. H2 appears at 1.85 (H2A) and 1.58 (H2B). There are two multiplets because the ring structure holds the two protons in different positions. H2 correlates to H1 at 1.12 and 1.34 ppm.
Fig. 3. COSY spectrum of cholesteryl acetate in CDCl3

Fig. 4. Expanded region of the COSY spectrum of cholesteryl acetate in CDCl3
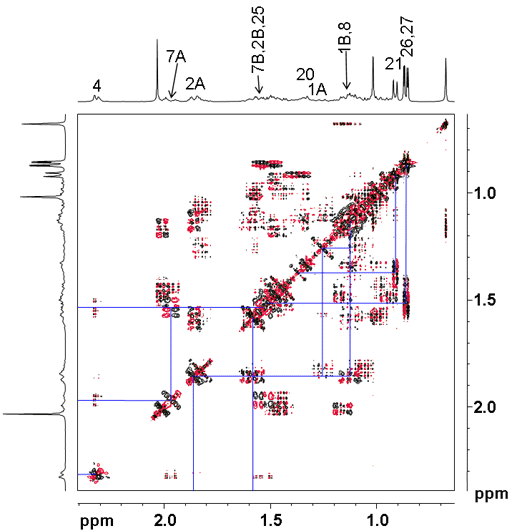
The 13C NMR spectrum (fig. 5) shows 29 signals (not including the solvent). There is one signal at 170.60 ppm in the carbonyl/carboxyl region that corresponds to C28. There are two vinyl carbons in the molecule, one of which is attached to a proton and is therefore expected to appear at lower chemical shift. The two signals that are present in the vinyl region are therefore assigned to C6 at 122.64 ppm and C5 139.64 ppm. C3 is attached to an oxygen and expected to be in the region 60 to 80 ppm. The only signal in this region is at 74.01 ppm. Of the remaining carbons only three are definitely in the methyl region (11.84, 18.70 and 19.29 ppm). The other three methyls are in the region that overlaps the other aliphatic carbons between 21 and 57 ppm. C29 would be expected at between 20 and 25 ppm so this is not one of the three assigned. The relatively short relaxation times for the aliphatic carbons preclude the immediate assignment of the quaternary carbons C5, 10 and 13. This is as far as a 1D carbon assignment can reasonably go. APT, and DEPT would differentiate the different types (C, CH, CH2, and CH3) but 2D methods are more sensitive, quicker to run at low concentrations and provide more information.
Fig. 5. 13C-NMR spectrum of cholesteryl acetate in CDCl3
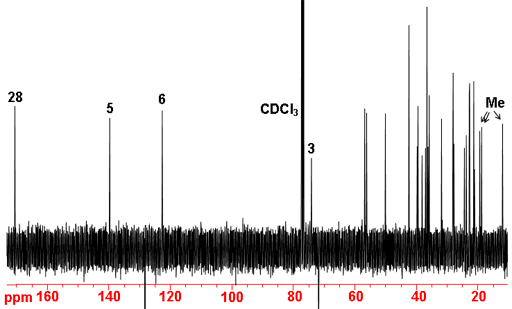
The short-range (one-bond) 1H-13C correlation (HSQCSI) spectrum (fig. 6) confirms the assignment of C3 and C6 and provides a direct assignment of C1 at 23.81, C2 at 27.76, C4 at 38.10, C7 at 31.88, C20 at 35.78, C21 at 18.70, C25 at 28.00 and C26 and C27 at 22.54 and 22.80 ppm.
Fig. 6. short-range (one-bond) 1H-13C correlation (HSQCSI) spectrum of cholesteryl acetate in CDCl3
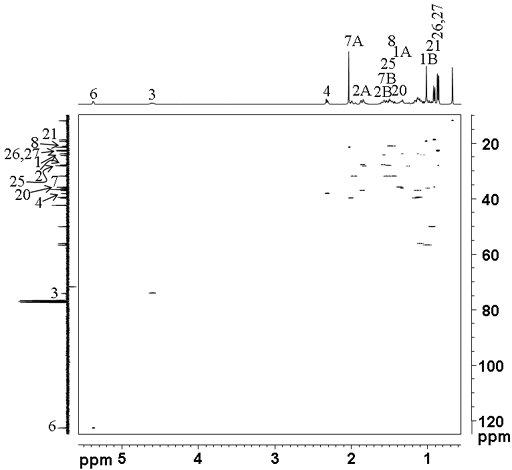
However, we can take advantage of the 'useful artifact' of HSQCSI (fig. 7) that gives signals between protons but separated on the carbon axis, overcoming the overlap problems in the COSY spectrum. The weak signals represent correlations to the proton attached to the neighboring carbon.
Fig. 7. Part of the HSQCSI spectrum of cholesteryl acetate in CDCl3 showing the 'useful artifact'
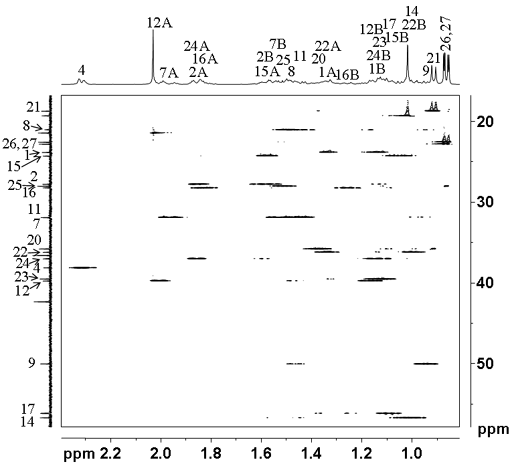
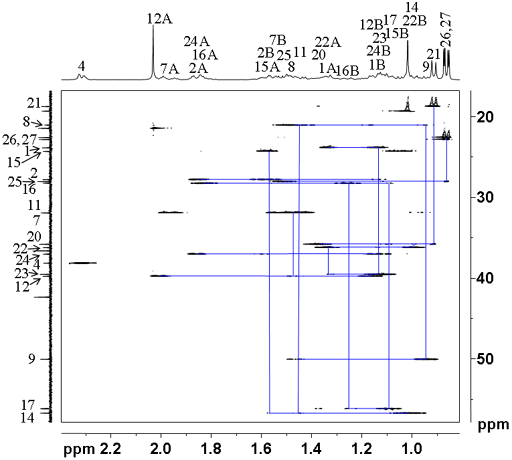
One can then draw a connectivity diagram (fig. 8) and assign all the signals with the exception of the two quaternary carbons and the methyls 18 and 19. For example, we know from the COSY that H21 correlates with H20. From the HSQCSI, we know that C20 is at 35.78 ppm. From the 'useful artifact' we see the neighboring protons, one of H17 (1.09 ppm) and two of H22 (1.00, 1.33 ppm). C17 (56.12 ppm) in turn correlates with H16 (1.25, 1.83 ppm) and C16 (28.21 ppm) with H15 (1.07, 1.57 ppm). Likewise, C22 (36.17 ppm) correlates with H23 (1.12 ppm). However, H23 overlaps strongly with H24 so the assignment of C24 is made from the correlation to H25.
Fig. 8. Part of the HSQCSI spectrum of cholesteryl acetate in CDCl3 showing connictivity via the 'useful artifact'
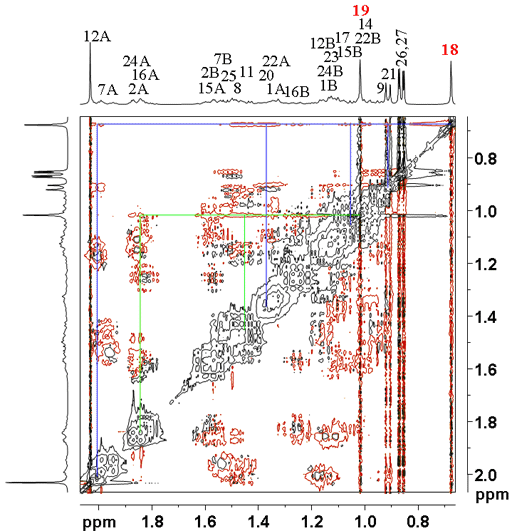
Now that we have most of the assignment, we can return to the NOESY spectrum (fig. 9) in order to assign the methyls (H18 and 19). The signal at 0.68 ppm clearly correlates with H12A (2.01 ppm) and H21 (0.91 ppm) that are expected to correlate with H18. The other correlations are unclear due to overlap so the assignment (labeled in red in fig. 9) is for H18 at 0.68 ppm and H19 at 1.02 ppm. From the HSQCSI we have C18 and C19 at 11.84 and 19.29 ppm.
Fig. 9. Part of the NOESY spectrum of cholesteryl acetate in CDCl3 showing correlations to methyls 18 and 19
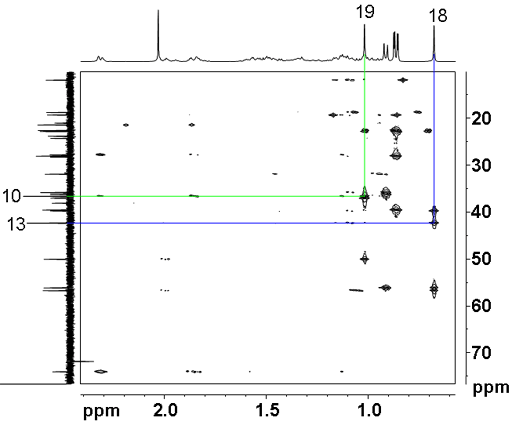
All that remains is to assign the two quaternary carbons, C10 and C13 using a long-range 1H-13C correlation (HMBC) spectrum (fig. 10). A two bond correlation to the methyl protons in each case yields the assignment of C10 at 36.58 ppm and C13 at 42.30 ppm. The other correlations confirm the other assignments.
Fig. 10. Part of the long-range 1H-13C correlation (HMBC) spectrum of cholesteryl acetate in CDCl3 showing correlations from H18 and H19 to C13 and C10
Finally, we have the full assignment of cholesteryl acetate.
Table 1. Chemical shifts of cholesteryl acetate
| Atom number | δH/ppm | δC/ppm |
|---|---|---|
| 1 | 1.12,1.34 | 23.81 |
| 2 | 1.58,1.85 | 27.76 |
| 3 | 4.60 | 74.01 |
| 4 | 2.30,2.33 | 38.10 |
| 5 | 139.64 | |
| 6 | 5.37 | 122.64 |
| 7 | 1.52,1.96 | 31.88 |
| 8 | 1.48 | 21.01 |
| 9 | 0.94 | 50.02 |
| 10 | 36.58 | |
| 11 | 1.45 | 31.85 |
| 12 | 1.16,2.01 | 39.72 |
| 13 | 42.30 | |
| 14 | 1.00 | 56.68 |
| 15 | 1.07,1.57 | 24.27 |
| 16 | 1.25,1.83 | 28.21 |
| 17 | 1.09 | 56.12 |
| 18 | 0.68 | 11.84 |
| 19 | 1.02 | 19.29 |
| 20 | 1.37 | 35.78 |
| 21 | 0.91 | 18.70 |
| 22 | 1.00,1.33 | 36.17 |
| 23 | 1.12,1.12 | 39.50 |
| 24 | 1.13,1.86 | 36.98 |
| 25 | 1.51 | 28.00 |
| 26,27 | 0.860,0.863 | 22.54,22.80 |
| 28 | 170.60 | |
| 29 | 2.03 | 21.42 |