Solid-state NMR
Reasons for broad signals
Generally, liquid samples (provided that they are homogeneous and diamagnetic) yield sharp signals in NMR spectroscopy. This is despite the existence of large dipolar interactions and chemical shift anisotropy that, were it not for rapid isotropic molecular tumbling, would broaden the spectrum to the extent that it would be unobservable with a high-resolution NMR spectrometer (figs. 1, 2).
The 1H-NMR and 13C-NMR spectra of solids under regular acquisition conditions, show signals usually wider than their chemical shift range and too broad to observe with a regular high-resolution NMR spectrometer.
In the intermediate case between liquids and solids when the liquid is viscous or a gel and/or the molecule is large (such as a protein) then less broadening is observed.
Fig. 1. 1H-NMR spectrum of a static sample of solid isopropyl-β-D-thiogalactopyranose (top) compared with a solution state spectrum in DMSO-d6 (bottom). The spectrum is over an order of magnitude broader than its chemical shift range so no chemical shift information can be discerned.
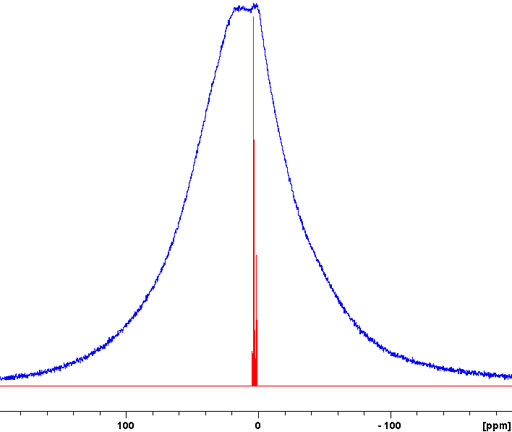
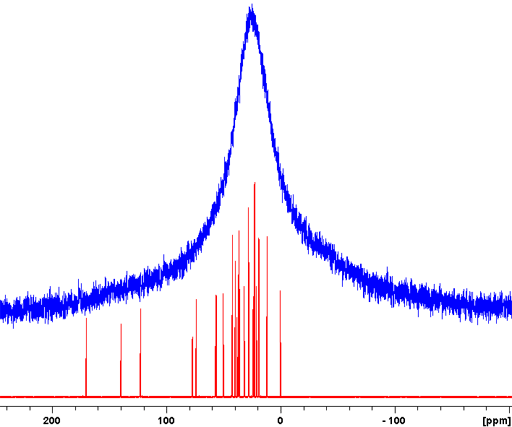
Fig. 2. 13C-NMR spectrum with regular decoupling of a static sample of solid cholesteryl acetate (top) compared with a solution state spectrum in CDCl3 (bottom). The spectrum is as broad as its chemical shift range so little if any chemical shift information can be discerned. The spectrum is further broadened by heteronuclear dipolar coupling because the decoupling power that is used for scalar decoupling is not sufficient.
The effects of chemical shift anisotropy and homonuclear dipolar coupling can be all but removed for spin-½ nuclei (1H, 13C, etc.) by spinning the sample very fast about the magic angle (54.736° to the vertical). However, such spin speeds are not always achievable and a combination of high-power multiple pulse decoupling and fast spinning around the magic angle may be required.
1H in the solid-state
Some reduction in proton line-width can be achieved by magic angle spinning (fig. 3). However, to remove homonuclear dipolar coupling effects in solid 1H-NMR spectra, extremely high spinning speeds on the order of 70 kHz and/or high-power pulses are required during the acquisition. This method is called CRAMPS (Combined Rotation and Multiple-Pulse Sequence) and usually requires high-power amplifiers and a wide-bore magnet. However, reasonable results can be achieved using multipulse decoupling with somewhat less power as with our spectrometers. We use the wPMLG5 (windowed Phase-Modulated Lee-Goldburg 5-step) variant of CRAMPS and can achieve line-widths of 200 Hz (fig. 4). Note that the isopropyl methyls are split by 0.5 ppm in the wPMLG5 spectrum because their rotation is frozen in the crystal.
Fig. 3. Full range 1H MAS spectrum of solid isopropyl-β-D-thiogalactopyranose: static spectrum, spinning at 12 kHz, wPMLG5 and in solution
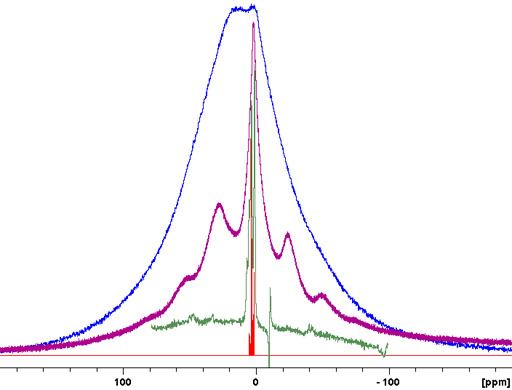
Fig. 4. Expanded 1H MAS spectrum of solid isopropyl-β-D-thiogalactopyranose: static spectrum, spinning at 12 kHz, wPMLG5 and in solution
Spin-½ nuclei (13C, etc.)
For spin-½ nuclei, 13C, 15N, etc., NMR the homonuclear dipolar coupling is usually insignificant due to its low abundance or isolation of the nuclei. The heteronuclear dipolar coupling can be decoupled with high-power. However, because of the very long relaxation times of most non-proton (e.g., 13C) signals in the solid-state, relaxation delays of typically several minutes are required between pulses. A notable exception is adamantine (fig. 5), which is a plastic crystal, for which a relaxation delay of five seconds is sufficient.
Fig. 5. High-power decoupled (HPDEC) 13C spectrum of adamantine with magic angle spinning
When there are protons in the vicinity (up to several bonds away) then sensitivity is greatly increased and relaxation delays greatly reduced to the proton relaxations time by exciting the 1H and 13C together with matching spin-lock pulses in a process called cross-polarization that works via dipolar coupling. This is combined with magic angle spinning at around 5 to 15 kHz to yield a high resolution spectrum. The technique is called cross polarized magic angle spinning (CP-MAS). However, this technique usually leaves residual spinning sidebands that may be suppressed using SELTICS (Sideband ELimination by Temporary Interruption of the Chemical Shift) or TOSS (TOtal Sideband Suppression) pulse sequences.
Cholesteryl acetate yields an excellent example of a CP-MAS spectrum (fig. 6) with some signals as narrow as 15 Hz. Note that all the solid-state signals it this spectrum are split by comparison with the solution spectrum, indicating the presence of two separate crystal environments in the solid state.
Fig. 6. 13C CP-MAS spectrum of solid cholesteryl acetate (top) with spinning-sideband suppression compared with the solution state spectrum in CDCl3 (bottom).

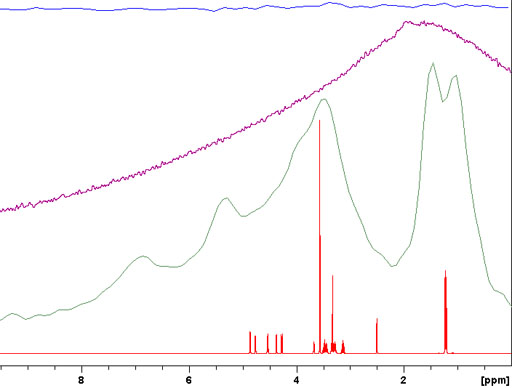
The CP-MAS spectrum is not always as highly resolved as the example above but may still give much useful information. An example of this is the Murex Trunculus dye who's active dye ingredients are indigo and its bromo-derivatives. The sample of the commercial product is not entirely soluble so the main portion of it is not visible in the solution spectrum. A combination of 13C (fig. 7), 15N (fig. 8) and 31P-CP-MAS (fig. 9) shows that it mostly contains proteins and organic phosphates.
Fig. 7. 13C CP-MAS spectrum of Murex dye showing a spectrum typical of proteins
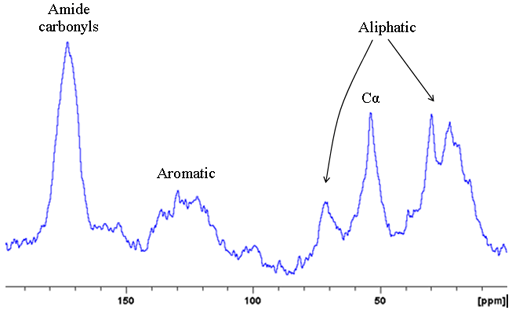
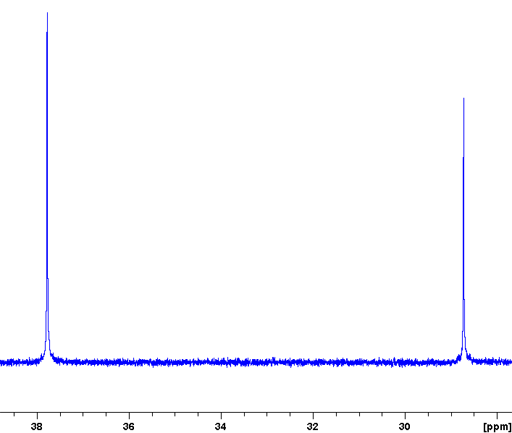
Fig. 8. 15N CP-MAS spectrum of Murex dye showing a signal in the protein amide region
Fig. 9. 31P CP-MAS spectrum of Murex dye showing a spectrum typical of organic phosphates

Relaxation filters
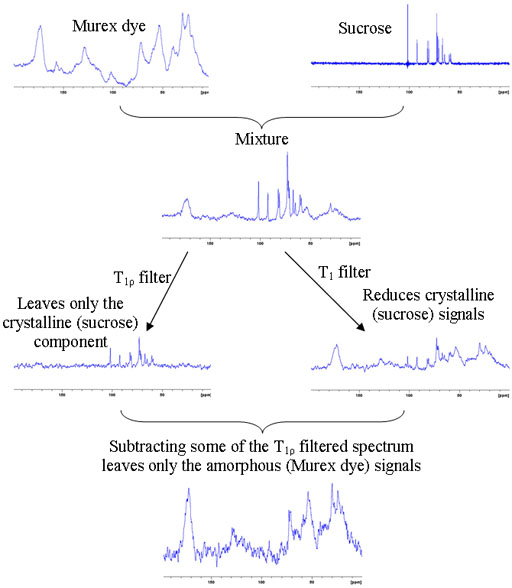
The relaxation times of solid-state proton signals are very dependent on the degree of order in the sample. Amorphous samples generally relax faster than crystalline samples. This is useful in the study of inhomogeneous solids including micro- and nano-heterogeneous samples such as nanoparticle matrices, porous media and block copolymers. To demonstrate the method a mixture of amorphous murex dye was mixed with crystalline sucrose. A filter for long rotational relaxation, T1ρ, effectively removes the amorphous signals leaving only the sucrose spectrum. A filter for short longitudinal, T1, relaxation reduces the sucrose signals dramatically and these can be removed by linear combination with the T1ρ filtered spectrum leaving only the spectrum of the dye (fig. 10).
Fig. 10. Demonstration of the use of relaxation filters for differentiating cyrstalline and amorphous components
2D-Solid state NMR
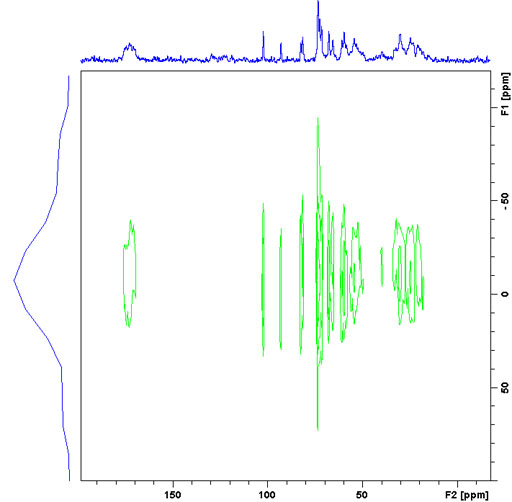
Just as in the liquid-state, it is possible to carry out two-dimensional NMR in the solid-state. Heteronuclear correlation in the solid-state is usually achieved using dipolar coupling. The range of the correlation depends on the contact time. Short contact times of around 50 μs yield one-bond correlations (fig. 11) while longer contact times of 1 to 10 ms also yield long-range correlations (fig. 12).
Fig. 11. Short-range 13C-1H CPHETCOR spectrum of Tyrosine HCl

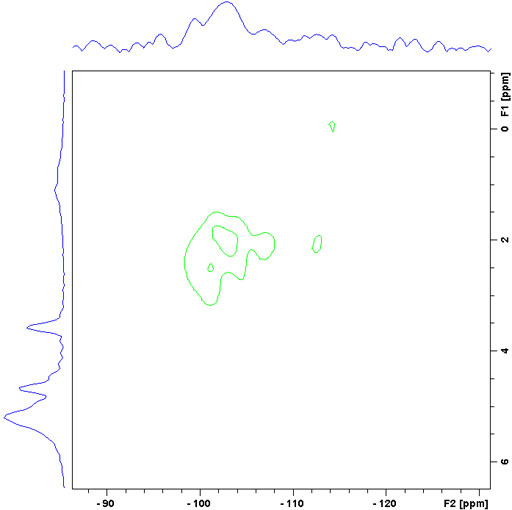
The correlating nucleus need not be 13C and longer-range correlations can be detected than in the liquid-state. For example in silica sol-gels, it is possible to observe correlations from proton to 29Si.
Fig. 12. Long-range 29Si-1H CPHETCOR of a sol-gel
The lines in the 1H spectrum in the static solid-state spectrum are orders of magnitude wider than their chemical shift dispersion. However, their individual widths vary and provide an indication of the rigidity of their environment. A 2D wide line spectrum (CPWISE) can be used to observe the individual lines by dispersing them according to their 13C chemical shifts (fig. 13).
Fig. 13. A CPWISE spectrum of a mixture of murex dye and sucrose showing differing line-widths indicative of variations in rigidity
Quadrupolar nuclei
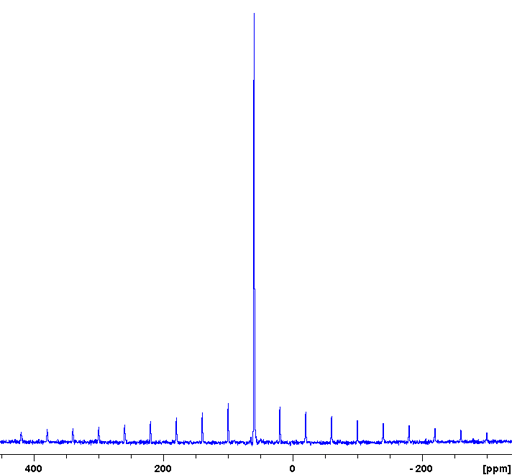
For quadrupolar nuclei, the line-width is not reduced as much as for spin-½ nuclei by magic angle spinning on its own. The solid-state quadrupolar spectra of nuclei with non-integer (3/2, 5/2, 7/2 and 9/2) spins consist of two different transition types: a relatively narrow (a few kHz wide) central transition (CT) and a broad (typically with line-widths in the MHz region) multiple quantum (MQ) transition. Magic angle spinning at achievable speeds narrows the CT typically by a factor of three or four and yields spinning sidebands over the region of the MQ transition. If the nucleus of the CT is in a highly symmetrical environment such as for potassium bromide (KBr) then a regular single pulse experiment with magic angle spinning may be sufficient to yield a sharp signal (with sidebands) (fig. 14). Note that it is customary to use the 79Br spectrum of KBr rather than the 81Br spectrum for probe calibration, even though 79Br is slightly less sensitive and less resolved than 81Br, because its resonance frequency is close to that of 13C reducing the need for retuning the probe.
Fig. 14. 79Br-MAS spectrum of KBr
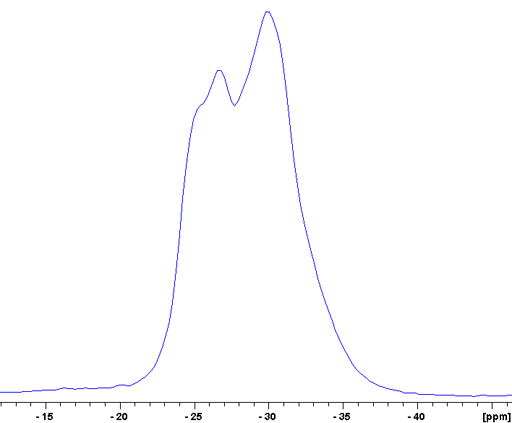
Usually, the CT signal is not narrow and signals cannot be separated. In such a case there may be unresolved signals corresponding to different environments. Rubidium nitrate (RbNO3) is an example of this (fig. 15). The 87Rb spectrum of RbNO3 shows spinning sidebands covering over one MHz.
Fig. 15. 87Rb-MAS of RbNO3 showing the full spectral range

The CT of RbNO3 is a broad signal that contains at least two unresolved components (fig. 16).
Fig. 16. Expansion of the central transition (CT) region of the 87Rb-MAS of RbNO3
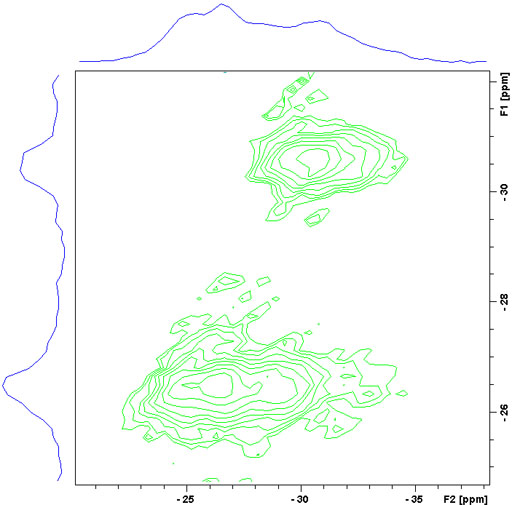
To resolve these signals a Multiple Quantum Magic Angle Spinning (MQ-MAS) experiment (fig. 17) or a Satellite Transition Magic Angle Spinning (ST-MAS) experiment (fig. 18) is required. ST-MAS yields much higher sensitivity than MQ-MAS but is very sensitive to the setting of the magic angle and other parameters making it difficult to achieve the resolution possible with MQ-MAS. With careful experimental preparation, ST-MAS will usually yield superior results to those of MQ-MAS. Both experiments yield a two dimensional spectrum with the broad quadrupolar CT signals in f2 and the sharper isotropic signals in f1. The ST-MAS experiment of RbNO3 shows two separate components for the rubidium signal.
Fig. 17. 87Rb-ST-MAS spectrum of RbNO3. The f1 projection yields the isotropic spectrum.
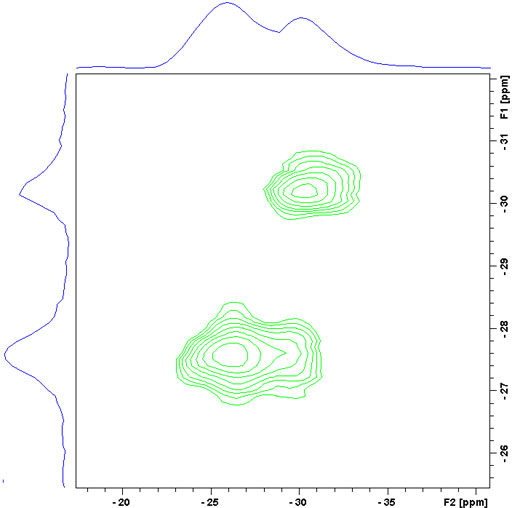
Fig. 18. 87Rb-MQ-MAS spectrum of RbNO3. The f1 projection yields the isotropic spectrum.
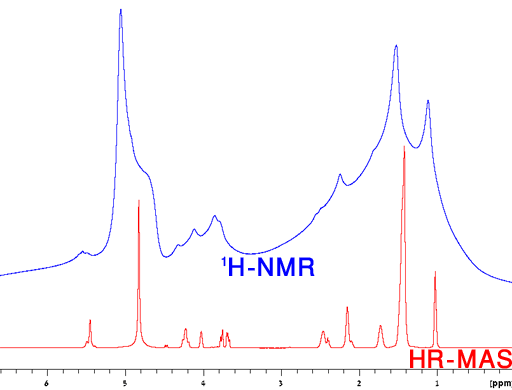
HR-MAS of semi-solids
Semi-solid samples include, emulsions, liquid crystals, gels, biological tissues and other micro- and nano-structured liquids. The more viscous or gelatinous the fluid, the more likely that HR-MAS can improve the resolution. An example of a very viscous liquid crystal is shown in fig. 19.
Fig. 19. Comparison of a regular 1H NMR spectrum with the HR-MAS spectrum of a liquid crystal
Milk is an emulsion and is shown here as an example. In a regular liquids probe the signals are broadened compared to those of homogeneous solutions (fig. 20). The observed shifts of the oil phase signals compared to the water signal are not the pure chemical shifts but include a bulk magnetic susceptibility (BMS) shift.
Fig. 20. Regular 1H-NMR spectrum of 3% fat milk with inversion recovery water suppression showing broadened signals and bulk magnetic susceptibility (BMS) shifts in the oil phase.
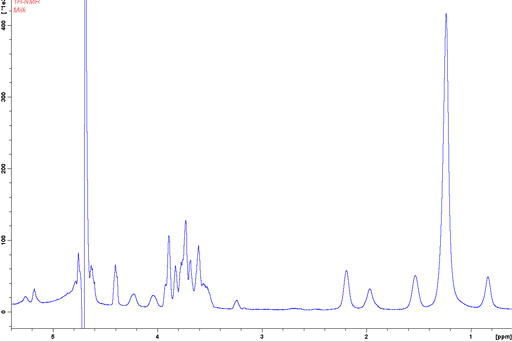
When the sample is spun at 4 kHz at the magic angle the signals become much sharper (fig. 21) and the BMS shift becomes zero allowing a direct comparison of chemical shifts between the oil and the water phase.
Fig. 21. Regular 1H-NMR spectrum of 3% fat milk with inversion recovery water suppression showing broadened signals and bulk magnetic susceptibility (BMS) shifts in the oil phase.

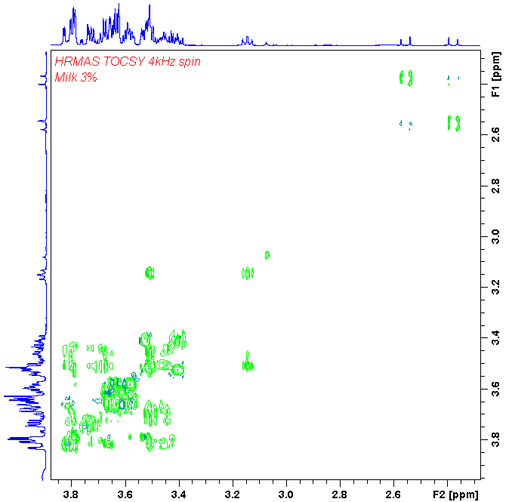
The presence of sharp signals allows the application of liquid-state 2D techniques such as TOCSY (fig. 22).
Fig. 22. TOCSY HR-MAS spectrum of 3% fat milk
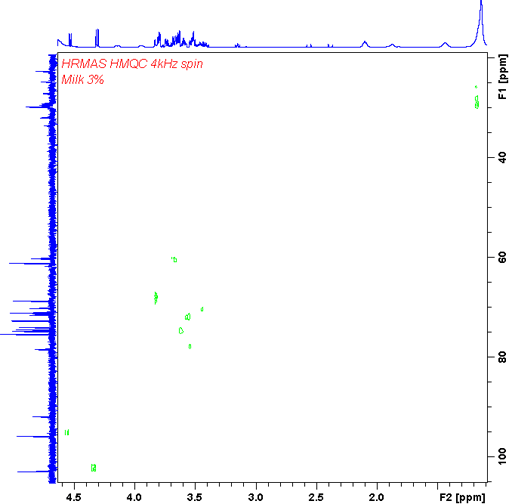
In our HR-MAS probe we have a gradient coil that allows gradient enhanced 2D-NMR like COSY (fig. 23) and heteronuclear correlation (fig. 24).
Fig. 23. Gradient enhanced double quantum COSY HR-MAS spectrum of 3% fat milk
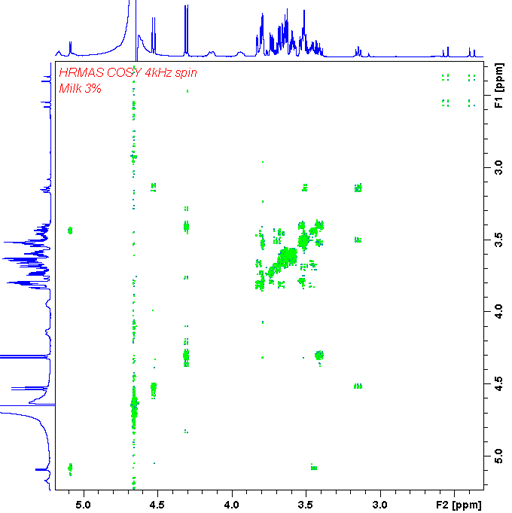
Fig. 24. Gradient enhanced HMQC (heternouclear correlation) HR-MAS spectrum of 3% fat milk