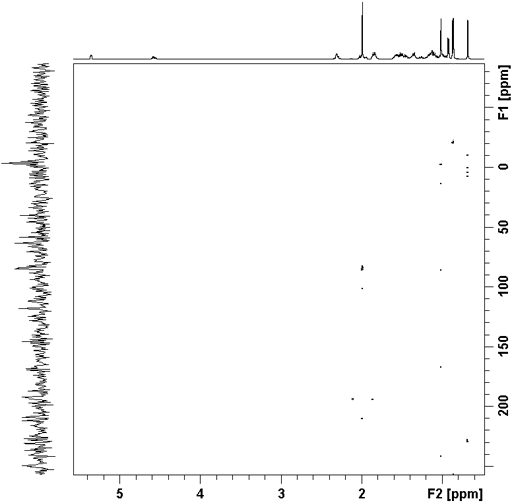
2D ADEQUATE
2D ADEQUATE (Adequate DoublE QUAntum Transfer Experiment) is useful for determining which signals arise from coupled carbon pairs using proton detection. It is insensitive as only 0.01% of the carbons are excited at natural abundance but the proton detection makes it much more sensitive than 2D INADEQUATE. As a result, good sensitivity is achieved with 0.2 molar samples instead of the 2 molar samples required for 2D INADEQUATE. If you can enrich the sample to about 10% 13C then the ADEQUATE experiment can be run with low sample concentrations. A 2D ADEQUATE spectrum yields correlations via spin-spin coupling from pairs of coupled 13C's to protons. The spectrum correlates the proton frequency on the f2 axis with the double-quantum carbon frequency (i.e. the sum of the two correlating carbon frequencies) on the f1 axis, making the spectrum somewhat complicated to interpret. There are no diagonal signals. Signals that correlate with carbons similar chemical shifts loose sensitivity due to second order coupling.
There are four common types of ADEQUATE experiments depending on the number of bonds that the correlations take place over: 1,1 one-bond proton to one-bond carbon; 1,n one-bond proton to multi-bond carbon; n,1 multi-bond proton to one-bond carbon and n,n multi-bond proton to multi-bond carbon. Fig.1 shows the pulse sequence for 1,1- and 1,n-ADEQUATE and fig. 2 shows the pulse sequence for n,1- and n,n-ADEQUATE. 1,1- and 1,n-ADEQUATE spectra are fully phase sensitive while n,1- and n,n-ADEQUATE spectra can only be phased in f1 as with long-range heteronuclear correlation and for the same reason.
Fig. 1. Pulse sequence for 1,1- and 1,n-ADEQUATE

Δ1 = 1/4(1JCH), Δ2 = 1/4(JCC), Δ3 = 1/4(1JCH) for CH only and 1/6(1JCH) for all multiplicities
Fig. 2. Pulse sequence for n,1- and n,n-ADEQUATE
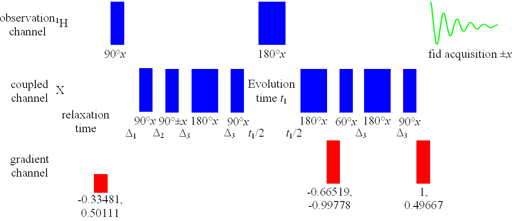
Δ1 = 1/4(1JCH), Δ2 = 1/4(nJCH), Δ3 = 1/4(JCC)
For the purposes of the ADEQUATE pulse sequences: the one-bond carbon-carbon coupling constant (1JCC) is usually 35 to 45 for a single bond and about 65 Hz for a double bond and are increased by electronegative substituents. Long-range (two or three-bond) carbon-carbon coupling constants (nJCH) are of the order of 11 Hz.
The 1,1-ADEQUATE spectrum of phenanthrene (fig. 3) is shown in fig. 4. The double-quantum correlations appear at δA+δB-δo where A and B are the coupled carbons and δo is the carbon observation chemical shift (at the center of the spectrum). In practice this formula is only accurate to about 0.05 ppm for one-bond and 0.02 for multiple bond due to 13/12C isotope shifts. For example (fig. 4, table 1), H1 at 8.83 ppm correlates with C1-C8b (122.91 and 130.58 ppm). The center of the 13C spectrum was set to 127.63 ppm so the correlation would be expected at 125.86 ppm but is observed at 125.81 ppm due to the isotope shift. The same analysis is applied to the 1,n-ADEQUATE - (fig. 5), n,1-ADEQUATE (fig. 6) and n,n-ADEQUATE (fig. 7) spectra. Table 1 lists the calculated (calcd. DQ shift) and measured (meas. DQ shift) double quantum chemical shifts for each pair of carbons and lists the types of (1,1-; 1,n-; n,1- and/or n,n-)ADEQUATE spectrum for which each correlation appears. The ADEQUATE spectrum is complicated by the symmetry of the molecule and that C2 and C3 chemical shifts are too close to separate
Fig. 3. Structure of phenanthrene
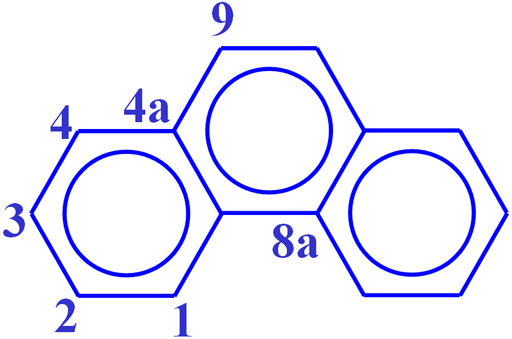
Fig. 4. 1,1-ADEQUATE spectrum of phenanthrene
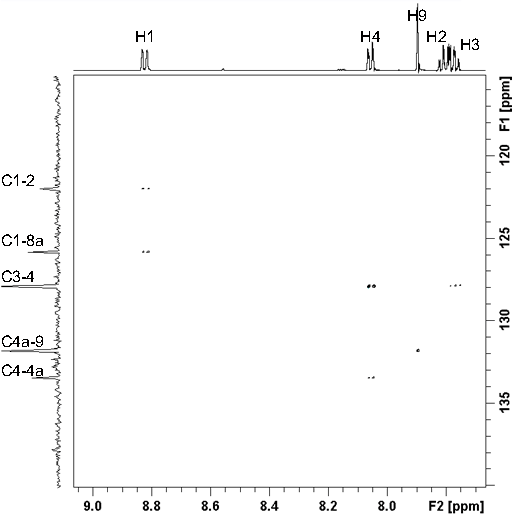
Fig. 5. 1,n-ADEQUATE spectrum of phenanthrene
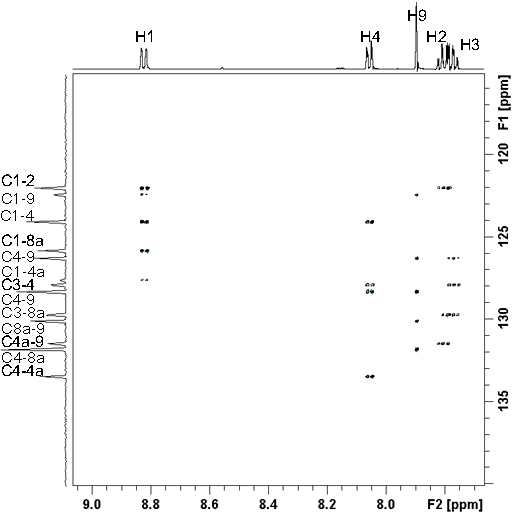
Fig. 6. n,1-ADEQUATE spectrum of phenanthrene
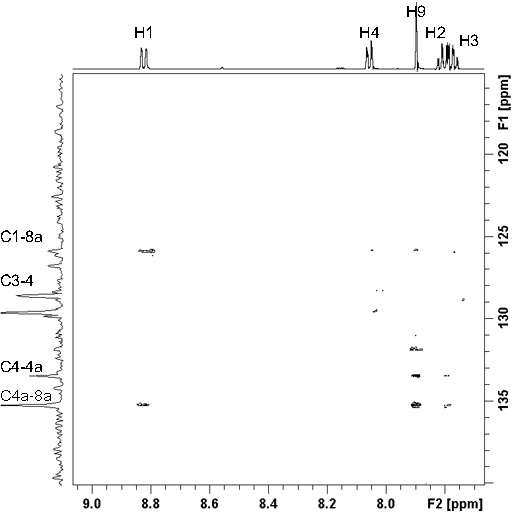
Fig. 7. n,n-ADEQUATE spectrum of phenanthrene
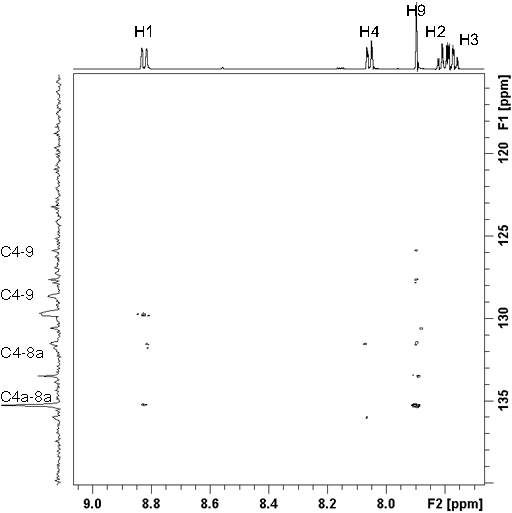
Table 1. Correlations for the ADEQUATE of phenanthrene with a 13C observation shift at 127.63 ppm
| C/H | 13C shifts | calcd. DQ shift | meas. DQ shift | H1 8.83 ppm | H2 7.77 ppm | H3 7.81 ppm | H4 8.06 ppm | H9 7.90 ppm |
|---|---|---|---|---|---|---|---|---|
| C1-C2 | 122.91, 126.77 | 122.05 | 121.97 | 1,1; 1,n | 1,1; 1,n | |||
| C1-C4 | 122.91, 128.80 | 124.08 | 124.08 | 1,n | 1,n | |||
| C1-C4a | 122.91, 132.32 | 127.60 | 125.82 | 1,1; 1,n; n,1 | n,1 | |||
| C1-C9 | 122.91, 127.15 | 122.43 | 122.41 | 1,n | 1,n | |||
| C3-C4 | 126.77, 128.80 | 127.94 | 127.88 | 1,1; 1,n | 1,1; 1,n | |||
| C2-C4a | 126.77, 132.32 | 131.46 | 131.47 | n,n | 1,n | n,n | ||
| C2,3-C8a | 126.77, 130.58 | 129.72 | 129.72 | n,n | 1,n | 1,n | ||
| C3-C9 | 126.77, 127.15 | 126.29 | 126.27 | 1,n | 1,n | |||
| C4-C4a | 128.80, 132.32 | 133.49 | 133.44 | n,1 | 1,1; 1,n | n,1 | ||
| C4-C8a | 128.80, 130.58 | 131.75 | 131.79 | n,n | 1,n | |||
| C4-C9 | 128.80, 127.15 | 128.32 | 128.31 | 1,n | 1,n; n,n | |||
| C4a-C8a | 132.32, 130.58 | 135.27 | 135.21 | n,1; n,n | n,1 | n,1; n,n | ||
| C4a-C9 | 132.32, 127.15 | 131.84 | 131.82 | 1,1; 1,n; n,1 | ||||
| C8a-C9 | 130.58, 127.15 | 130.11 | 130.09 | 1,n |
The ADEQUATE experiment can be carried out for more complicated examples such as cholesteryl acetate (fig. 8). In principle, the (1,1 - fig. 9; 1,n - fig. 10; n,1 - fig.11 and n,n - fig.12) ADEQUATE spectra can be used to confirm the assignment of cholesteryl acetate. You are welcome to try.
Fig. 8. Structure of cholesteryl acetate
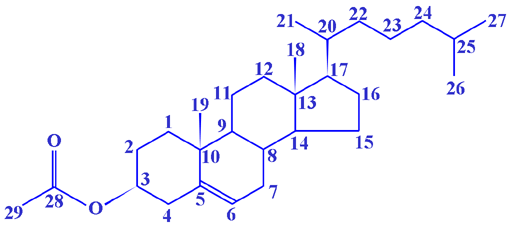
Fig. 9. 1,1-ADEQUATE spectrum of cholesteryl acetate
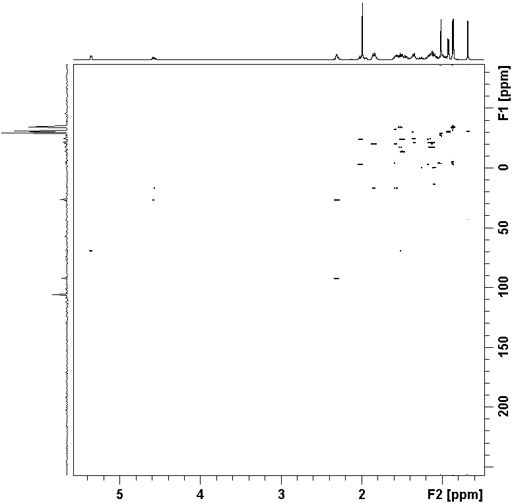
Fig. 10. 1,n-ADEQUATE spectrum of cholesteryl acetate
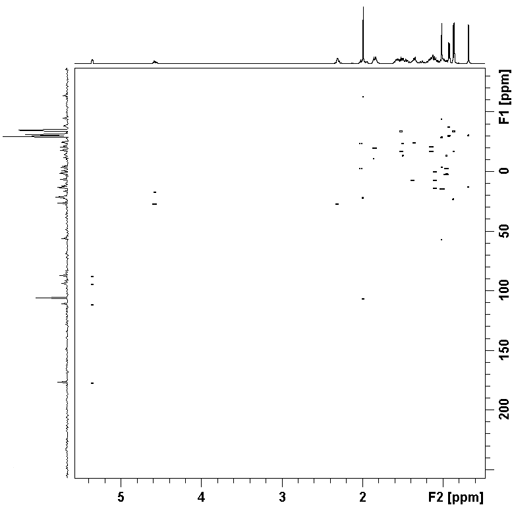
Fig. 11. n,1-ADEQUATE spectrum of cholesteryl acetate
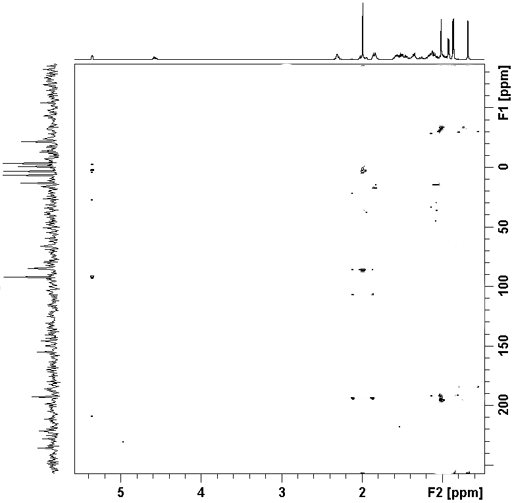
Fig. 12. n,n-ADEQUATE spectrum of cholesteryl acetate
