Long-range heteronuclear correlation
Heteronuclear coupling (such as from 1H to 13C) is used to assign the spectrum of another nucleus once the spectrum of one nucleus is known. It may also be of help in assigning the spectra of both nuclei even when a partial assignment of one or both is available. Such an experiment may also provide chemical information which the spectra of neither nucleus can provide alone.
However, not all the nuclei of the correlating nucleus are necessarily directly connected to a proton and so cannot be observed using short-range heteronuclear correlation. Long-range heteronuclear correlation can yield signals for these nuclei while suppressing one-bond correlations. The most common application of this technique is for 1H-13C. Δ1 and Δ2 are set to 1/(2Jone-bond) and Δ3 to 1/(2Jlong-range). As the long-range couplings are not all the same and although a value of 10 Hz for 1H-13C and 8 Hz for 1H-15N is usually a good compramise (table 1). Although it is rarely done, to be sure that all the correlations are observed, it is best to run the experiment for a few different values of Δ3. The phase is strongly dependent on the long range and homonuclear proton coupling constant so each multiplet has a different phase with an extreme first order component. Therefore, it is usual practice to use a magnitude calculation in f2 and phase only in f1.
Long-range correlation requires 1H line-width of less than 5 Hz for 1H to 13C and less than 4 Hz for 1H to 15N. Usually the HMBC pulse sequence (fig. 1) is used with optional suppression of one-bond couplings. This suppression may be omitted in order to increase sensitivity slightly. The f1 resolution of the HMBC experiment is compramised by 1H-1H coupling effects (fig. 2) so if the digital resolution in f1 is better than 8 Hz without zero-filling and the 1H resolution is high then the long-range HSQCsp pulse sequence (fig. 3) is more sensitive and yields better f1 resolution (fig. 4).
Fig. 1. HMBC pulse sequence for long-range heteronuclear correlation
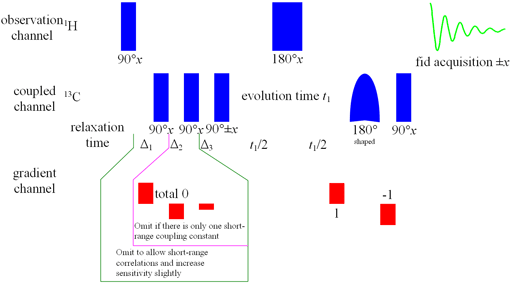
Fig. 2. HMBC showing reduced resolution in f1 due to 1H-1H coupling artifacts
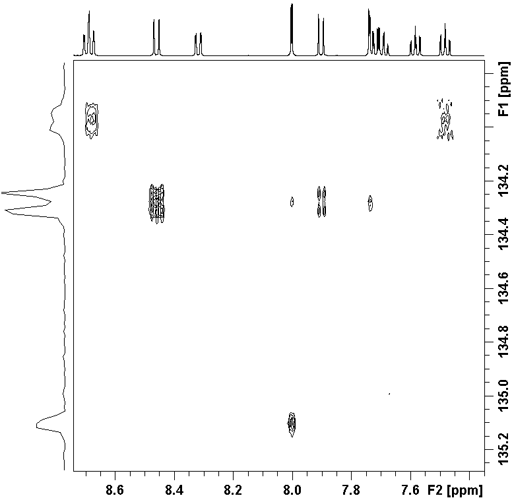
Fig. 3. Long-range HSQCsp pulse sequence
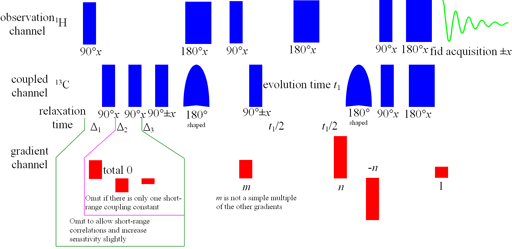
Fig. 4. Long-range HSQCsp showing increased resolution in f1
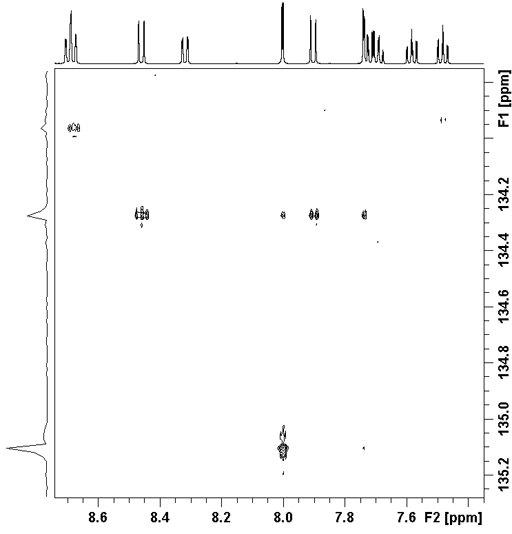
Table 1. Gradient ratios and coupling constants for long-range correlation
| X nucleus | nHSQC | JAXshort-range | JAXlong-range |
|---|---|---|---|
| 13C | 1.99 | 125 Hz sp3, 160 Hz sp2 | 10 Hz |
| 15N | 4.93 | 80 Hz | 8 Hz |
| 29N | 2.52 | 6.6 Hz | |
| 31P | 1.24 | 7 Hz |
The correlation spectrum does not contain a diagonal. Each proton signal may be correlated with one or more carbon signals. Those signals in the 1D spectra that do not correlate with carbons do not appear in the 2D spectrum. In the case of ethylbenzene (fig. 5), all the three-bond correlations and some two-bond correlations appear strongly (fig. 6). The cross-peaks are analyzed using a correlation table (table 2). For ethylbenzene the analysis is simple. An example of the application of a correlation table to a more complex molecule is shown later.
Fig. 5. Structure of ethylbenzene
Fig. 6. 2D HMBC spectrum of ethylbenzene
Table 2. Correlation table of the HMBC spectrum of ethylbenzene showing the number of bonds for each correlation
| C/H | 1' | 2' | 2 | 3 | 4 |
|---|---|---|---|---|---|
| 1' | 2 | ||||
| 2' | 2 | 2 | |||
| 1 | 2 | 3 | 3 | ||
| 2 | 3 | 3 | 3 | ||
| 3 | 3 | ||||
| 4 | 3 |
Using the example of 12,14-ditbutylbenzo[g]chrysene (fig. 7), the proton spectrum can be assigned by NOESY or ROESY and the carbons that are attached to protons can be assigned by HSQC or HMQC. This leaves the carbons that are not directly attached to protons unassigned. For this, the HMBC long-range 1H-13C correlation is used (fig. 8).
Fig. 7. Structure of 12,14-ditbutylbenzo[g]chrysene
![12,14-ditbutylbenzo[g]chrysene](hmbc_files/dtbbgc.gif)
Fig. 8. 2D HMBC spectrum of 12,14-ditbutylbenzo[g]chrysene
![HMBC of 12,14-ditbutylbenzo[g]chrysene](hmbc_files/dtbbgchmbc.gif)
The spectrum shows mainly three-bond correlations along with mostly weaker two and four-bond correlations. One-bond correlations are mostly suppressed but can be seen as doublets on the tbutyl methyls. The likely number of bonds is one of the parameters used to assign the spectrum. Two-bond correlations show the correct assignment of tbu12q at 34.24 ppm and tbu14q at 38.94 ppm while three-bond correlations assign C12 and 14 to 149.20 and 147.27 ppm, respectively. The remainder of the correlations (fig. 9) are shown in table 3 and assignment made so that the most three-bond correlations are observed strongly while the fewest three-bond correlations are missing.
Fig. 9. Aromatic region of the 2D HMBC spectrum of 12,14-ditbutylbenzo[g]chrysene
![HMBC of 12,14-ditbutylbenzo[g]chrysene](hmbc_files/aromatic.gif)
Table 3. Correlation table of the HMBC spectrum of 12,14-ditbutylbenzo[g]chrysene showing the number of bonds for each correlation: black for strong, blue for weak and red for not observed
| C/H | 1 | 2 | 3 | 4 | 5 | 6 | 7 | 8 | 9 | 10 | 11 | tbu12 | 13 | tbu14 |
|---|---|---|---|---|---|---|---|---|---|---|---|---|---|---|
| 1 | 3 | |||||||||||||
| 2 | 3 | |||||||||||||
| 3 | 3 | |||||||||||||
| 4 | 3 | |||||||||||||
| 4a | 3 | 3 | 3 | |||||||||||
| 4b | 3 | 3 | 3 | |||||||||||
| 5 | 3 | |||||||||||||
| 6 | 3 | |||||||||||||
| 7 | 3 | |||||||||||||
| 8 | 3 | |||||||||||||
| 8a | 3 | 3 | 3 | |||||||||||
| 8b | 3 | 2 | 3 | |||||||||||
| 9 | ||||||||||||||
| 10 | 3 | |||||||||||||
| 10a | 3 | |||||||||||||
| 11 | 3 | 3 | 3 | |||||||||||
| 12 | 2 | |||||||||||||
| tbu12q | 3 | 3 | 3 | |||||||||||
| tbu12Me | ||||||||||||||
| 13 | 3 | |||||||||||||
| 14 | 3 | |||||||||||||
| tbu14q | 3 | 2 | ||||||||||||
| tbu14Me | 3 | |||||||||||||
| 14a | 3 | 3 | 3 | |||||||||||
| 14b | 3 | 3 | ||||||||||||
| 14c | 3 |
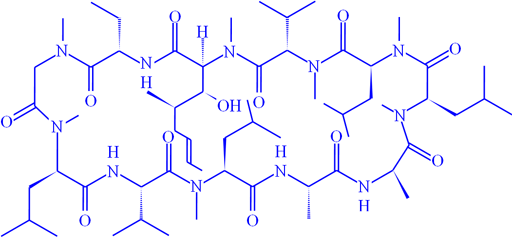
1H-15N long-range correlation can be observed when the 1H signals are sufficiently narrow. Fig. 10 shows the long-range correlation 1H-15N for cyclosporin A (fig. 11).
Fig. 10. 2D 1H-15N HMBC spectrum of cyclosporin A
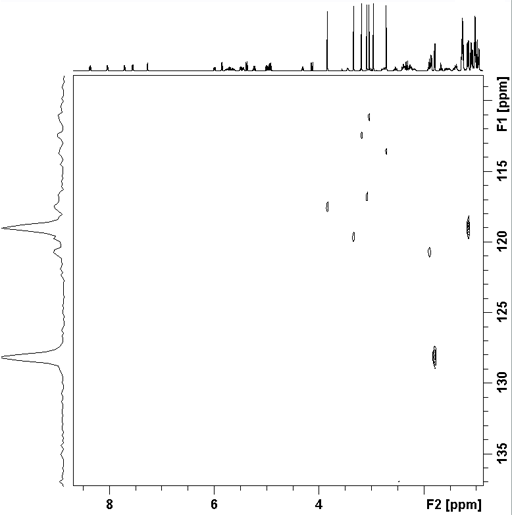
Fig. 11. Structure of of cyclosporin A