1D-NMR
Use our NMR service for 1D and other NMR experiments.
One-dimensional (1D) NMR spectroscopy includes regular (1H) Proton, 13Carbon and spectra of other nuclei. There are two main types of one-dimensional experiment, regular and decoupled.
The regular 1D NMR experiment
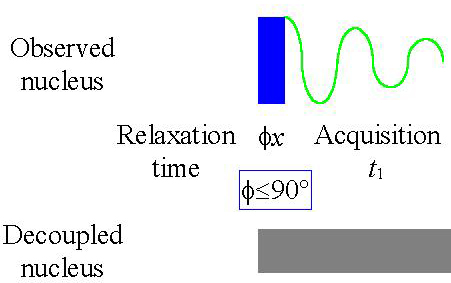
Measurement of a regular 1D NMR experiment is carried out in three stages and it is convenient to explain the process by reference to the vector model:
- The sample reaches equilibrium.
- An rf signal is transmitted (according the pulse
sequence in fig. 1) of sufficient power (~50 W) and for a sufficient period of time
(a few microseconds). In order to move the magnetization vector from the z-axis to the
x,y-plane (a pulse of up to 90°).
Fig. 1. Basic 1D-NMR pule sequence
- The signal that evolves due to precession of the magnetization vector is measured after the pulse. At the end of the process, the vector returns to equilibrium on the z-axis. The process is called free induction decay (fid) of the magnetization.
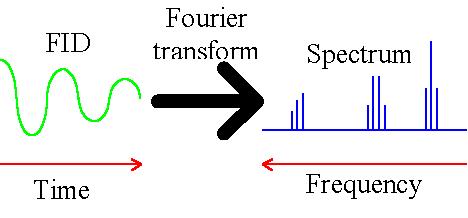
- The measured fid is the variation of magnetization with time. Because the information in the
signal is incomprehensible as it is, we are interested in a spectrum of intensity versus
frequency. Therefore, there is a need to transform from the time domain to the frequency domain
using a mathematical procedure on the fid called a Fourier transform. In the fid signal there is
a repetitive component that is frequency dependent. A Fourier transform (fig. 2) reveals the frequency
component in the fid and results in the desired spectrum – intensity versus frequency.
Fig. 2. Fourier transform
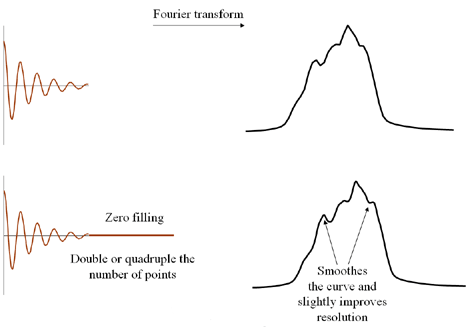
- The resolution of the spectrum can be improved slightly by adding zeros to the end of the FID,
a process known as zero filling (fig. 3). The disadvantage is that this uses extra computing
resources.
Fig. 3. Zero filling
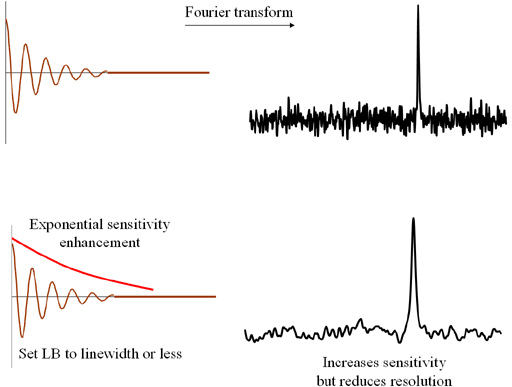
- The sensitivity or resolution (but not both together to a great extent) of the spectrum can be
improved by multiplying the FID by a window function (apodization) before Fourier transformation.
An exponential decay function is used to increase sensitivity (fig. 4). The strength of the decay
is set by the line-broadening (on Bruker and Varian, LB and on JEOL and Mestre-C, width) factor in
Hz. For greatest effect, LB should be set to the line-width at half height. However, with the
increase in sensitivity comes a loss in resolution.
Fig. 4. Sensitivity enhancement
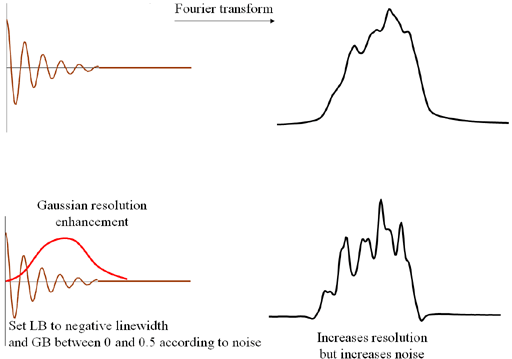
 The resolution can be enhanced by using a Gaussian function (fig. 5) for which there are two parameters: a
line narrowing parameter that should be set to the line-width (on Bruker it is a negative LB, on
JEOL and Mestre-C it is a positive width) and a Gaussian broadening parameter (on Bruker GB is a
fraction of the acquisition on JEOL it is the shift, the point on the time axis in seconds where
the function is maximum and on Mestre-C it is a percent shift) between zero and 0.5 (it can be set
higher but this is pointless) that should be set as high as possible without losing the signal
into the noise. Gaussian resolution enhancement reduces sensitivity.
The resolution can be enhanced by using a Gaussian function (fig. 5) for which there are two parameters: a
line narrowing parameter that should be set to the line-width (on Bruker it is a negative LB, on
JEOL and Mestre-C it is a positive width) and a Gaussian broadening parameter (on Bruker GB is a
fraction of the acquisition on JEOL it is the shift, the point on the time axis in seconds where
the function is maximum and on Mestre-C it is a percent shift) between zero and 0.5 (it can be set
higher but this is pointless) that should be set as high as possible without losing the signal
into the noise. Gaussian resolution enhancement reduces sensitivity.
Fig. 5. Resolution enhancement
 For acquisition data with only a few points and the FID is truncated (usually the case for 2D NMR)
it is convenient to use one function for both resolution and sensitivity enhancement, choosing which
by changing one parameter. For this, a sine-bell or sine-bell squared function is used. On Bruker the
SSB parameter is set to 2 for sensitivity enhancement and 1 for resolution enhancement.
For acquisition data with only a few points and the FID is truncated (usually the case for 2D NMR)
it is convenient to use one function for both resolution and sensitivity enhancement, choosing which
by changing one parameter. For this, a sine-bell or sine-bell squared function is used. On Bruker the
SSB parameter is set to 2 for sensitivity enhancement and 1 for resolution enhancement.
Decoupled 1D NMR
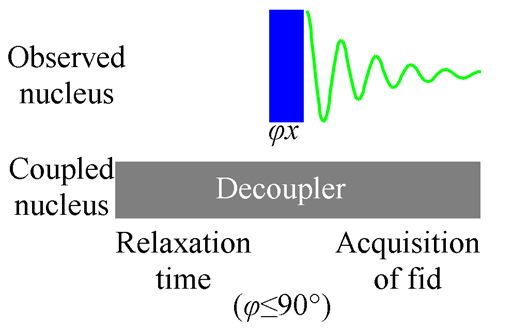
In some cases heteronuclear coupling from another nucleus with magnetic spin causes the signal to split and its sensitivity to fall. This effect is especially important for low sensitivity nuclei. For example, 13C NMR, the signal is small and is split into multiplets making the individual signals smaller still. The required action is to apply decoupling to the neighboring nucleus (see fig. 6 for the pulse sequence). There are a number of decoupling methods but the underlying theme is that all of them transmit an rf signal with a bandwidth of a few kilohertz of more at the Larmor frequency of the neighboring nucleus (that differs from the Larmor frequency of the observed nucleus). There result transitions in nuclear spin energy that annul the spin coupling. As a result the unified signal appears stronger. Another reason for the change in intensity is the nuclear Overhauser effect (NOE). In the case of carbon, the effect may amplify the signal intensity by almost four times for carbons directly connected to hydrogen. The pulse sequence improves the sensitivity but makes the integration meaningless because the amplification is different for each signal.
Fig. 6. Pulse sequence for 1D acquisition with decoupling
Gated decoupled 1D NMR
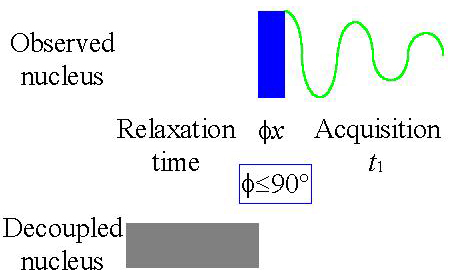
Decoupling is not always desired. For example one wishes to observe the couplings to the other nucleus such as protons attached a carbon. Of cause it is possible to acquire the spectrum without any decoupling but then one loses the sensitivity enhancement from the NOE. Therefore one uses the fact that signal amplification occurs during the relaxation time while the transformation for multiplets to singlets occurs during acquisition. When one applies decoupling only during the relaxation time (see fig. 7 for the pulse sequence) the multiplet structure is preserved as is the signal amplification. This experiment is called gated decoupling.
Fig. 7. Gated decoupled 1D-NMR
Inverse gated decoupled 1D NMR
For some nuclei the nuclear Overhauser effect (NOE) is negative (not as we saw for carbon). For 15N it reduces the signal strength tenfold. Therefore, it is not recommended to apply decoupling during the relaxation time when it reduces the intensity. If decoupling is still desired then it is advisable to carry out the inverse gated decoupling experiment (see fig. 8 for the pulse sequence) that yields a decoupled spectrum without reducing the signal strength. When integration is required for a 13C spectrum, this experiment can be used with a long relaxation time, although the sensitivity is dramatically reduced as compared to measuring carbon with regular decoupling.
Fig. 8. Inverse gated decoupled 1D-NMR