Nitrogen NMR
Use our NMR service that provides 14N, 15N-NMR and many other NMR techniques. We recommend 1H-15N heteronuclear correlation as a more sensitive alternative to 15N-NMR in most cases.
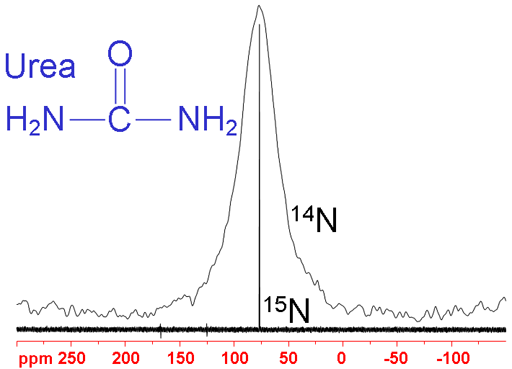
Nitrogen has two NMR active nuclei (fig. 1). 15N yields sharp lines but is very insensitive. 14N is a medium sensitivity nucleus but its signals are usually significantly broadened by quadrupolar interactions sometimes to the extent that they are unobservable on a high-presolution NMR spectrometer.
Fig. 1. Comparison of 14N and 15N spectra of urea. The 14N signal is extremely broad because it is quadrupolar.
A typical analysis of an N NMR spectrum consists of matching expected chemical shifts (fig. 2) to the expected moieties. Our NMR service provides 14N and 15N NMR along with many other NMR techniques. However, we recommend 1H-15N heteronuclear correlation as a more sensitive alternative to 15N-NMR in most cases. Each type of signal has a characteristic chemical shift range that can be used for assignment. The chemical shift ranges are the same for both nitrogen isotopes. IUPAC recommends CH3NO2 (90% in CDCl3) as the chemical shift standard for both nucleides (14N and 15N). However, most spectroscopists reference nitrogen spectra to liquid NH3 and IUPAC recommends this as an alternative for 15N. Here, the chemical shifts are referenced to liquid NH3 (under pressure) at 25°C even though this is against IUPAC recommendations for 14N. To convert 15N chemical shifts to the IUPAC CH3NO2 standard, subtract 380.5 ppm and for 14N, subtract 381.6 ppm.
Fig. 2. Chemical shift ranges of nitrogens according to their chemical environment

Choose the structure that most closely represents the nitrogen in question.
14N NMR
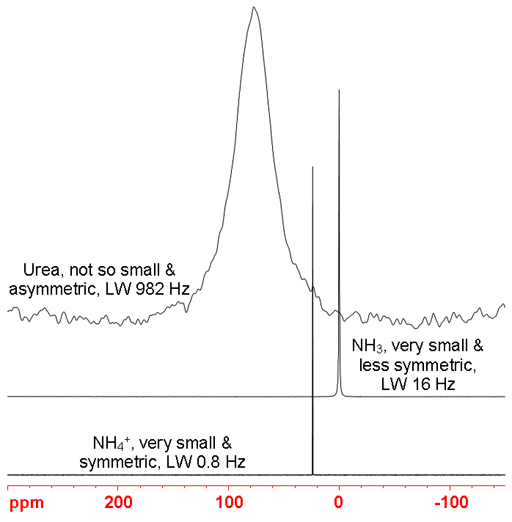
The 1D 14Nitrogen NMR experiment is much less sensitive than Proton (1H) but has a much larger chemical shift range. Its signals are broadened by quadrupolar interactions. The larger the molecule and the more asymmetric the nitrogen's environment, the broader the signal. Hence, the small and highly symmetric aqueous ammonium ion gives a very sharp line (fig. 3), less than one Hertz wide. Liquid ammonia, being less symmetric, is 16 Hz wide (on a 400 MHz spectrometer at room temperature). Urea is larger and asymmetric so the line-width is approximately 1 KHz. Molecules that are significantly larger than urea yield signals too broad to be observed with a high-resolution NMR spectrometer. However, the nitrogen chemical shift range is wide and so may be readily used for distinguishing nitrogen species for very small molecules.
Fig. 3. Comparison of line-widths of 14N signals. The larger and less symmetric the molecule, the wider the signal.
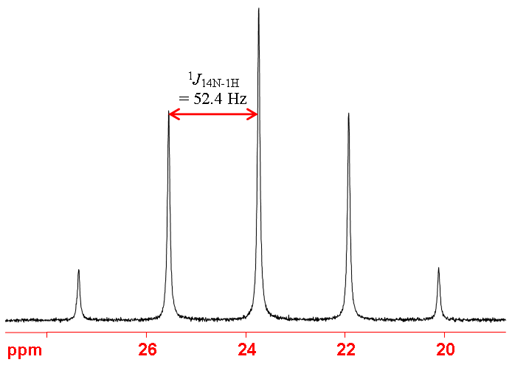
Heteronuclear coupling is rarely observed with 14N because of its quadrupolar broadening. It can be observed with protons of the ammonium ion (figs. 4, 5) at room temperature and liquid ammonia at low temperatures. Carbon signals of nitriles and NH protons are often broadened by residual coupling to 14N.
Fig. 4. 1H spectrum of natural abundance NH4Cl (1.5 M) in 1M HCl/H2O showing coupling to 14N as a (spin 1) triplet and coupling to 15N as a weak doublet. Note that the 14N coupling constant is smaller than that of 15N because of 14N's lower resonant frequency.
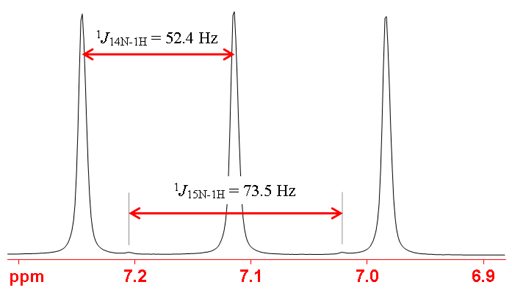
Fig. 5. 14N spectrum of NH4Cl (1.5 M) in 1M HCl/H2O showing coupling to 1H as a quintet due to the presence of four protons in an AX4 coupling pattern.
Properties of 14N
| Property | Value |
|---|---|
| Spin | 1 |
| Natural abundance | 99.63% |
| Chemical shift range | 900 ppm, from 0 to 900 |
| Frequency ratio (Ξ) | 7.226317% (NH3 7.223561%) |
| Reference compound | 90% CH3NO2 in CDCl3 |
| Linewidth of reference | 19 Hz |
| T1 of reference | 19 ms |
| Alternative reference (not IUPAC) | NH3 liquid, Ξ = 7.223561 |
| Linewidth of NH3 | 16 Hz |
| T1 of NH3 | 0.2 s |
| Receptivity rel. to 1H at natural abundance | 1.01×10⁻³ |
| Receptivity rel. to 1H when enriched | 1.01×10⁻³ |
| Receptivity rel. to 13C at natural abundance | 5.74 |
| Receptivity rel. to 13C when enriched | 5.74 |
| Linewidth parameter | 21 fm4 |
15N NMR
The 1D 15Nitrogen NMR experiment is much less sensitive than Proton (1H) and 13Carbon. Consequently, the 15Nitrogen is rarely sensitive enough and it is necessary to isotopically enrich (fig. 6) or to use the projection of a heteronuclear correlation (short range and long range) to improve sensitivity (Fig. 7). In order to obtain a short-range heteronuclear correlation, the NH protons must be in slow exchange and not deuterated. This precludes D2O and deuterated alcohol solutions. A common practice in biochemistry is either to use a non-exchanging solvent such as DMSO-d6 or 1:9 D2O/H2O combined with water suppression techniques. Long range heteronuclear correlation requires very sharp proton signals that undergo two or three bond coupling with a practical line-width limit of approximately 3 Hz but has the advantage of not requiring the presence of sharp NH signals.
Fig. 6. 15N NMR spectrum of 15N enriched Cyclosporin A (25 mM) in CDCl3. This spectrum was acquired in one hour. To obtain similar sensitivity without enriched would take about 10 years.
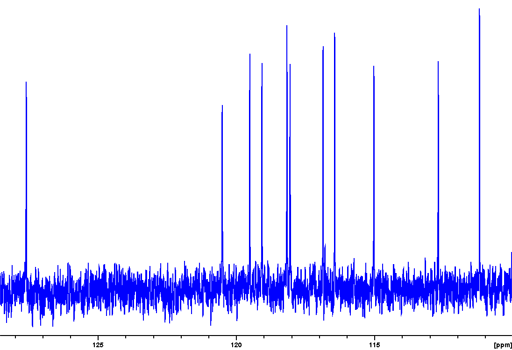
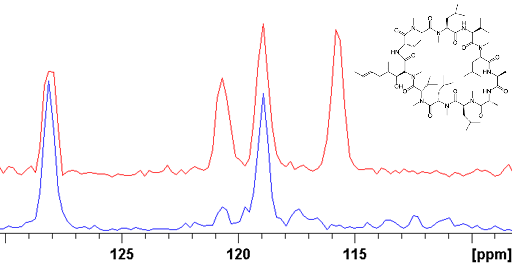
Fig. 7. 15N NMR spectrum of Cyclosporin A (25 mM) in DMSO-d6 obtained from the projection of a heteronuclear correlation. The upper red spectrum is of nitrogens directly attached to hydrogen. The lower blue spectrum includes weak signals from long-range correlations and suppresses nitrogens without long-range correlations.
The 1D 15Nitrogen NMR experiment yields narrow lines and has a large chemical shift range. Its low natural abundance (0.37%) makes its low sensitivity even worse so it is often enriched for NMR.
A typical analysis of a 15N NMR spectrum consists of matching expected chemical shifts to the expected moieties. A simple example is that of sodium azide (fig. 8) where the center nitrogen has a different chemical shift from the terminal nitrogens.
Fig. 8. 15N NMR spectrum of sodium azide (1M) in D2O

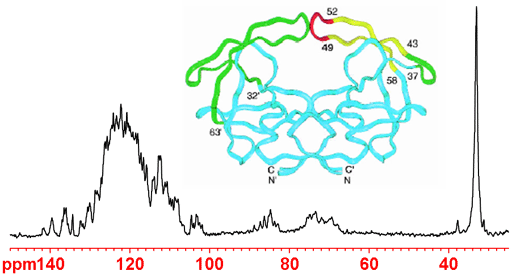
An alternative to using high concentrations and a necessity for large molecules is to enrich with 15N. However, this is very expensive and the cost of producing the example in fig. 9 is several thousand dollars.
Fig. 9. 15N NMR spectrum of enriched HIV-1 protease
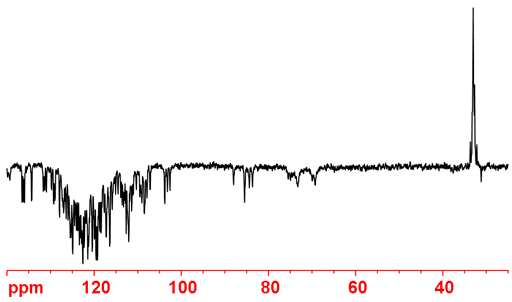
Decoupling leads to negative NOE, reducing or negating the signal (fig. 10). In order to prevent this, A DEPT experiment or very long relaxation delays of minutes or more are required.
Fig. 10. Decoupled 15N NMR spectrum of enriched HIV-1 protease showing signal inversion due to negative NOE. The peak on the right is not attached to protons so does not invert.
Heteronuclear coupling is observed with protons. One-bond couplings are of the order of 90 Hz and smaller 2, 3 and 4-bond coupling are observed. In some cases, very weak satellite signals can be observed in the 1H spectrum of NH signals (fig. 11) and can be used to confirm the assignment of NH signals.
Fig. 11. 1H spectrum of natural abundance urea (5 mM) in DMSO-d6 showing signal broadening arising from residual coupling to 14N and coupled 15N satellites. The satellites combined with main-signal broadening are a good indicator of NH signals in the 1H spectrum.

15N DEPT
Sensitivity of 15N can be greatly improved using the DEPT experiment (fig. 12), however, unprotonated nitrogens are suppressed.
Fig. 12. 15N DEPT spectrum of enriched HIV-1 protease. This experiment is much more sensitive and can be acquired faster but only protonated nitrogens appear.
Properties of 15N
| Property | Value |
|---|---|
| Spin | ½ |
| Natural abundance | 0.37% |
| Chemical shift range | 900 ppm, from 0 to 900 |
| Frequency ratio (Ξ) | 10.136767% or 10.1329111% |
| Reference compound | 90% CH3NO2 in CDCl3 or NH3 liquid |
| Linewidth of CH3NO2 | 0.14 Hz |
| T1 of CH3NO2 | 43 s |
| Linewidth of NH3 | 0.2 Hz |
| T1 of NH3 | 5 s |
| Receptivity rel. to 1H at natural abundance | 3.85×10⁻⁶ |
| Receptivity rel. to 1H when enriched | 1.04×10⁻³ |
| Receptivity rel. to 13C at natural abundance | 0.0219 |
| Receptivity rel. to 13C when enriched | 5.91 |
Safety note:
Safety note: Some of the materials mentioned here are very dangerous. Ask a qualified chemist for advice before handling them. Qualified chemists should check the relevant safety literature before handling or giving advice about unfamiliar substances. NMR solvents are toxic and most are flammable. Specifically, ammonia is toxic and the liquid is pressurized at room temperature: work in a hood. Ammonium chloride may be toxic: use protective gloves.