1H-1H ROESY
1H-1H ROESY (Rotating frame Overhause Effect SpectroscopY it has also been known as CAMELPSIN – Cross-relaxation Appropriate for Minimolecules Emulated by Locked SPINs) is useful for determining which signals arise from protons that are close to each other in space even if they are not bonded. A ROESY spectrum yields through space correlations via spin-spin relaxation. ROESY also detects chemical and conformational exchange.
We use the conventional ROESY pulse sequence (fig. 1). The mixing time (tm) should never be longer than 300 ms so as not to overheat the sample or spectrometer but should be between half T1 and T2 if T2 is not too long in order to achieve good sensitivity for spectral assignment. For quantitative ROESY, a shorter mixing time should be used. The attenuation of the spin-lock should be set so that the 90° pulse with will be less than 1/(2SWH) (SWH is the spectral width in Hz). An attenuation of 22 dB with a 50 W amplifier yielding a 90° pulse width of 110 μs is typical. However, for quantitative ROESY that is used for distance and exchange rate measurement, short mixing times and long relaxation delays are required. The strength of the ROE signal is proportional to the inverse sixth power of the distance between the atoms, I µ 1/r6. Comparison of the cross-peak integrals in a quantitative ROESY is used as a measure of the distance between the protons. Sensitivity of ROESY is increased by increasing the transverse relaxation time either by choosing a low-viscosity solvent such as acetone-d6 and/or removing dissolved oxygen from the sample.
Fig. 1. Pulse sequence for ROESY

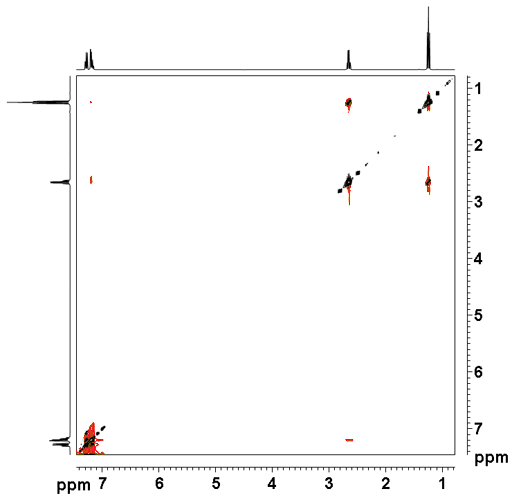
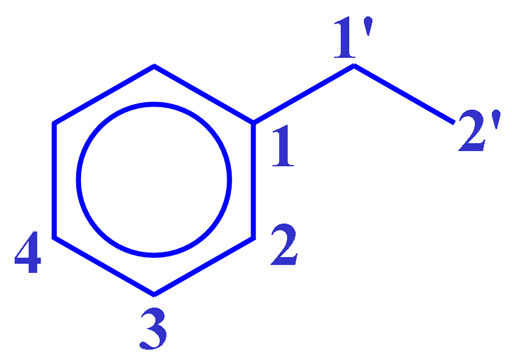
The ROESY spectrum as shown in fig. 2 for ethylbenzene (fig. 3) contains a diagonal and cross peaks. The diagonal consists of the 1D spectrum. The cross peaks signals arising from protons that are close in space. By convention, the diagonal is negative and all the desired ROE signals are positive and pure-phase. In practice, some plot the diagonal negative and some plot it positive. Here, the diagonal is plotted positive and the ROE signals are negative. ROE signals are intrinsically weaker than NOE signals acquired under ideal conditions. However, for intermediate sized molecules, the NOE intensity may be close to zero. Also, when the longitudinal relaxation time is long, the transverse relaxation time may be much shorter allowing acquisition of ROESY much quicker than of NOESY. TOCSY-type artifacts appear in correlations that are also bonded. The TOCSY signal is pure phase and negative by convention but plotted positive here. Ethylbenzene (fig. 3) does not show strong ROE correlations. The correlation between H1' and H2' at 2.65 and 1.24 ppm is mostly TOCSY type. A much weaker through-space correlation appears between H1' and H2 at 2.65 and 7.20 ppm. Exchange signals are also negative by convention but would appear positive as we plot them. In addition, artifacts (undesired signals) also appear in the spectrum as vertical streaks (interference and f1 noise) and along the inverted 'V'. These artifacts are rarely in phase with the desired signals and appear in specific locations (FIG. 4).
Fig. 2. 2D ROESY spectrum of ethylbenzene

Fig. 3. Structure of ethylbenzene

Fig. 4. Artifacts in the ROESY spectrum of ethylbenzene

For example, in 12,14-ditbutylbenzo[g]chrysene, (fig. 5) only a partial analysis of the regular 1H-NMR spectrum is possible. ROESY (fig. 6) provides extra information about the connectivity allowing a full assignment based on through-space correlations. As a result, the spectrum displays correlations to the tbutyls and between ring systems allowing a full assignment of the proton spectrum.
Fig. 5. Structure of 12,14-ditbutylbenzo[g]chrysene
![12,14-ditbutylbenzo[g]chrysene](roesy_files/dtbbgc.gif)
Fig. 6. 2D ROESY spectrum of 12,14-ditbutylbenzo[g]chrysene
![ROESY of 12,14-ditbutylbenzo[g]chrysene](roesy_files/roesydtbbgc.gif)
The aromatic region of the spectrum (fig. 7) shows three and four bond correlations that include a TOCSY type component in dispersive phase and negative pure phase signals for correlations between ring systems. These can be used to determine which protons are neighbors. For example the proton at 8.17 ppm is next to the proton at 7.34 ppm on the same ring, a fact that could not be easily determined from the 1D spectrum. The proton at 8.56 is on the ring next to the signal at 8.32 ppm, a fact that could not be determined from the 1D or the TOCSY or COSY spectrum. This shows the proton at 8.56 ppm is in a group of four protons next to a group of two protons. The only case in this molecule is the correlation between H8 and 9 which are now known to be at 8.56 and 8.32 ppm respectively.
Fig. 7. Aromaric region of the 2D ROESY spectrum of 12,14-ditbutylbenzo[g]chrysene
![Aromatic region of ROESY of 12,14-ditbutylbenzo[g]chrysene](roesy_files/aromaticdtbbgc.gif)
Continuing the connectivity, we can assign H10 as 7.76 ppm H11 as 7.60 ppm and H13 as 7.86 ppm. In the opposite direction, H7 is at 7.59 ppm , H6 at 7.55 ppm, H5 at 8.62 ppm, H4 at 8.54 ppm, H3 at 7.44 ppm, H2 at 7.34 ppm and H1 at 8.17 ppm. Fig. 8 shows the ROESY connectivity colored according their assignemnt to each ring (fig. 9).
Continuing the connectivity, we can assign H10 as 7.76 ppm H11 as 7.60 ppm and H13 as 7.86 ppm. In the opposite direction, H7 is at 7.59 ppm , H6 at 7.55 ppm, H5 at 8.62 ppm, H4 at 8.54 ppm, H3 at 7.44 ppm, H2 at 7.34 ppm and H1 at 8.17 ppm. Fig. 9 shows the NOESY connectivity colored according their assignemnt to each ring (fig. 10).
Fig. 8. Aromaric region of the 2D ROESY spectrum of 12,14-ditbutylbenzo[g]chrysene showing connectivity and separation into four color-coded proton groups
![Aromatic region of ROESY of 12,14-ditbutylbenzo[g]chrysene in color](roesy_files/coloraromatic.gif)
Fig. 9. Structure of 12,14-ditbutylbenzo[g]chrysene showing color conding of rings
![Color coded structure of 12,14-ditbutylbenzo[g]chrysene](roesy_files/dtbbgccolor.gif)
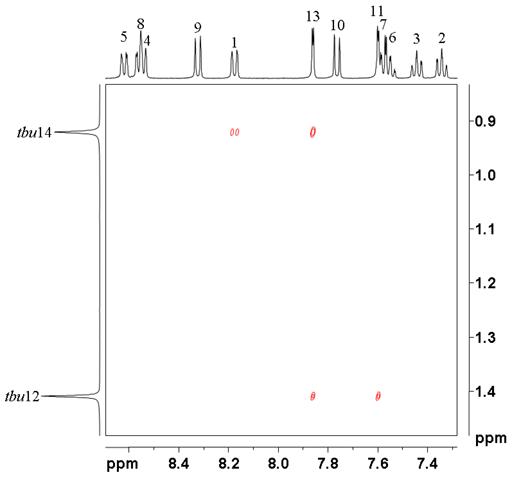
All that remains is to assign the tbutyls. tbu14 at 0.92 ppm correlates with H1 and 13 while tbu12 at 1.40 ppm correlates with H11 and 13 (fig. 10) confirming the provisional assignment of the 1H spectrum.
Fig. 10. tButyl regrion of the ROESY of 12,14-ditbutylbenzo[g]chrysene
